Research independence: This report contains no affiliate links, provider recommendations, lead routing, or commercial promotions. It was produced independently of The HRT Index's provider-comparison content. None of the source authors, journals, drugmakers, health systems, or data producers had a role in selecting, analyzing, reviewing, or publishing this page.
Hot flash statistics conflict because they measure different things. The broadest recent pooled estimate we identified comes from a 2024 global meta-analysis that included 265 hot-flash articles covering 349,608 middle-aged women and estimated prevalence at 52.65% (95% CI 50.24–55.06). That same analysis reported extreme heterogeneity — I² = 99.51% — and graded the certainty of the symptom-prevalence evidence as very low.
Meanwhile, the Study of Women's Health Across the Nation (SWAN) found frequent vasomotor symptoms lasting a median 7.4 years. The Penn Ovarian Aging Study estimated a median 10.2 years for moderate-to-severe hot flushes. A 2025 Australian study found moderately-to-severely bothersome hot flushes in 37.3% of women in late perimenopause.
None of those numbers contradicts the others. They answer different questions.
This page attaches its major headline numbers to the population, symptom definition, severity threshold, recall window, denominator, and estimator that produced them. It also corrects a denominator mismatch: the 321 studies and 482,067 women in the 2024 review cover all nineteen menopausal symptoms, not the hot-flash analysis by itself.
Hot flash statistics at a glance
| Question | Best available answer | What the denominator means |
|---|---|---|
| How common are hot flashes? | 52.65% pooled prevalence across 265 articles | 349,608 middle-aged women in a highly heterogeneous global meta-analysis |
| When does reporting rise most sharply? | About 48% reported hot flashes in the year before the final menstrual period and about 60% in the year after | Monthly self-report in the SWAN Menstrual Calendar substudy |
| How many occur on a symptomatic day? | 62.5% of current sufferers reported one or two | U.S. peri- and postmenopausal women who already reported current hot flashes |
| How long is one episode? | 43.4% reported one to two minutes; 68.7% reported one to five minutes | Current sufferers in the same U.S. survey |
| How many years can recurring symptoms last? | Median 7.4 years in SWAN; median 10.2 years in the Penn study | Different cohorts, thresholds, symptom definitions, and survival models |
Source: The HRT Index Hot Flash Statistics Evidence Atlas v1.0, compiled from the primary sources linked throughout this page. Last verified August 1, 2026.
Which hot flash statistic answers which question?
There is no single hot-flash percentage. Published figures vary because some studies count hot flashes alone while others combine hot flashes and night sweats; some count any symptom while others require a bothersome, moderate, severe, or frequent symptom; and some measure one point in time while others follow recurring symptoms for years.
This is the table to work from. Everything else on this page expands one of its rows.
| Figure | What it actually measures | Population or denominator | Safe to say | Comparability warning |
|---|---|---|---|---|
| 52.65% (95% CI 50.24–55.06) | Pooled prevalence of hot flashes | 265 articles; 349,608 middle-aged women | Broadest recent pooled estimate identified in this review | I² = 99.51%; very-low GRADE certainty; not an individual probability |
| Up to 80% | Clinical upper-bound summary of hot flashes and night sweats | Professional-society patient reference | Useful upper-bound clinical context | Combines hot flashes and night sweats; not a newly calculated pooled central estimate |
| 8.8% → 37.3% | Moderately-to-severely bothersome hot flushes, premenopause to late perimenopause | 1,250 premenopausal and 271 late-perimenopausal Australian participants | Recent stage-specific estimate for bothersome hot flushes | Cross-sectional stage comparison; not a within-person change and not any-severity prevalence |
| ~20% → ~48% → ~60% | Monthly hot-flash reporting several years before, one year before, and one year after the final menstrual period | 955 SWAN menstrual-calendar participants | Reporting rose sharply around the final menstrual period | Monthly occurrence in a longitudinal cohort; not lifetime experience |
| 63.9% | Moderate-to-severe VMS using the study's threshold | 11,378 users of a Spanish menopause app | Symptom burden in this selected app population | Cross-sectional convenience sample; not a national prevalence rate |
| 62.5% | Share reporting one or two hot flashes on a symptomatic day | 1,827 U.S. peri- and postmenopausal current sufferers | Most respondents in this current-sufferer group reported one or two | Denominator excludes women without current hot flashes; fielded in 2005 |
| 9.0 per day | Sum of four severity-specific mean daytime counts | 405 U.S. women reporting daytime hot flashes every day | A transparent calculation for a daily-symptom subgroup | Not a population average and not the average across all sufferers |
| 7.4 years | Median total duration of frequent VMS | 1,449 SWAN women with hot flashes or night sweats on at least six of the previous fourteen days | Major longitudinal estimate for frequent combined VMS | Combined VMS, not hot flashes alone; frequent symptoms, not any symptom |
| 10.2 years | Median duration of moderate-to-severe hot flushes | 259 Penn Ovarian Aging Study participants | Longitudinal survival estimate for this cohort and threshold | Different cohort, threshold, and estimator from the 7.4-year SWAN figure |
Source: The HRT Index Hot Flash Statistics Evidence Atlas v1.0. Row-level sources and formulas appear below. Last verified August 1, 2026.
The sentence to keep: pooled prevalence, monthly reporting, bothersome symptoms, selected symptomatic samples, episodes per day, minutes per episode, and years of recurring symptoms are seven different measurements. Quoting one as though it were another is the central error this atlas is designed to prevent.
What percentage of women get hot flashes?
The broadest recent pooled estimate we identified is 52.65%, drawn from 265 hot-flash articles covering 349,608 middle-aged women in a 2024 systematic review and meta-analysis. The estimate had extreme heterogeneity (I² = 99.51%), and the authors graded the certainty of the symptom-prevalence evidence as very low. It is a pooled summary of highly variable studies, not a personal probability.
The pooled global figure — and a denominator worth getting right
Fang and colleagues searched five databases for studies published from January 2000 through March 2023. The full review included 321 studies and 482,067 middle-aged women across nineteen menopausal symptoms.
The hot-flash analysis had a different denominator:
The 52.65% hot-flash estimate came from 265 articles comprising 349,608 middle-aged women — not from all 321 studies and 482,067 women in the broader review.
The difference is 132,459 participants. If 52.65% is the number being reported, 265 articles and 349,608 women is the matching evidence base.
Two findings belong beside that number every time it is used:
- I² = 99.51%. The included estimates varied enormously across studies.
- GRADE certainty: very low. The authors placed the certainty of the symptom-prevalence evidence at the bottom of the GRADE scale.
Primary source: Fang Y, Liu F, Zhang X, et al. Mapping global prevalence of menopausal symptoms among middle-aged women. BMC Public Health. 2024;24:1767.
Pooled prevalence by menopause stage
| Menopause stage | Pooled prevalence | 95% CI |
|---|---|---|
| Premenopause | 31.31% | 26.46–36.38 |
| Perimenopause | 56.52% | 51.54–61.43 |
| Postmenopause | 56.74% | 52.80–60.64 |
Source: Fang Y, Liu F, Zhang X, et al. BMC Public Health. 2024;24:1767, Table 1. These are pooled study-level subgroups, not within-person changes. Last verified August 1, 2026.
The HRT Index calculation: the postmenopausal pooled estimate is 25.43 percentage points above the premenopausal estimate and is 1.81 times as large. The perimenopausal estimate is 25.21 points above the premenopausal estimate.
Those arithmetic differences are reproducible. They do not prove that menopause stage alone caused the full gap because the subgroup estimates combine different studies and populations.
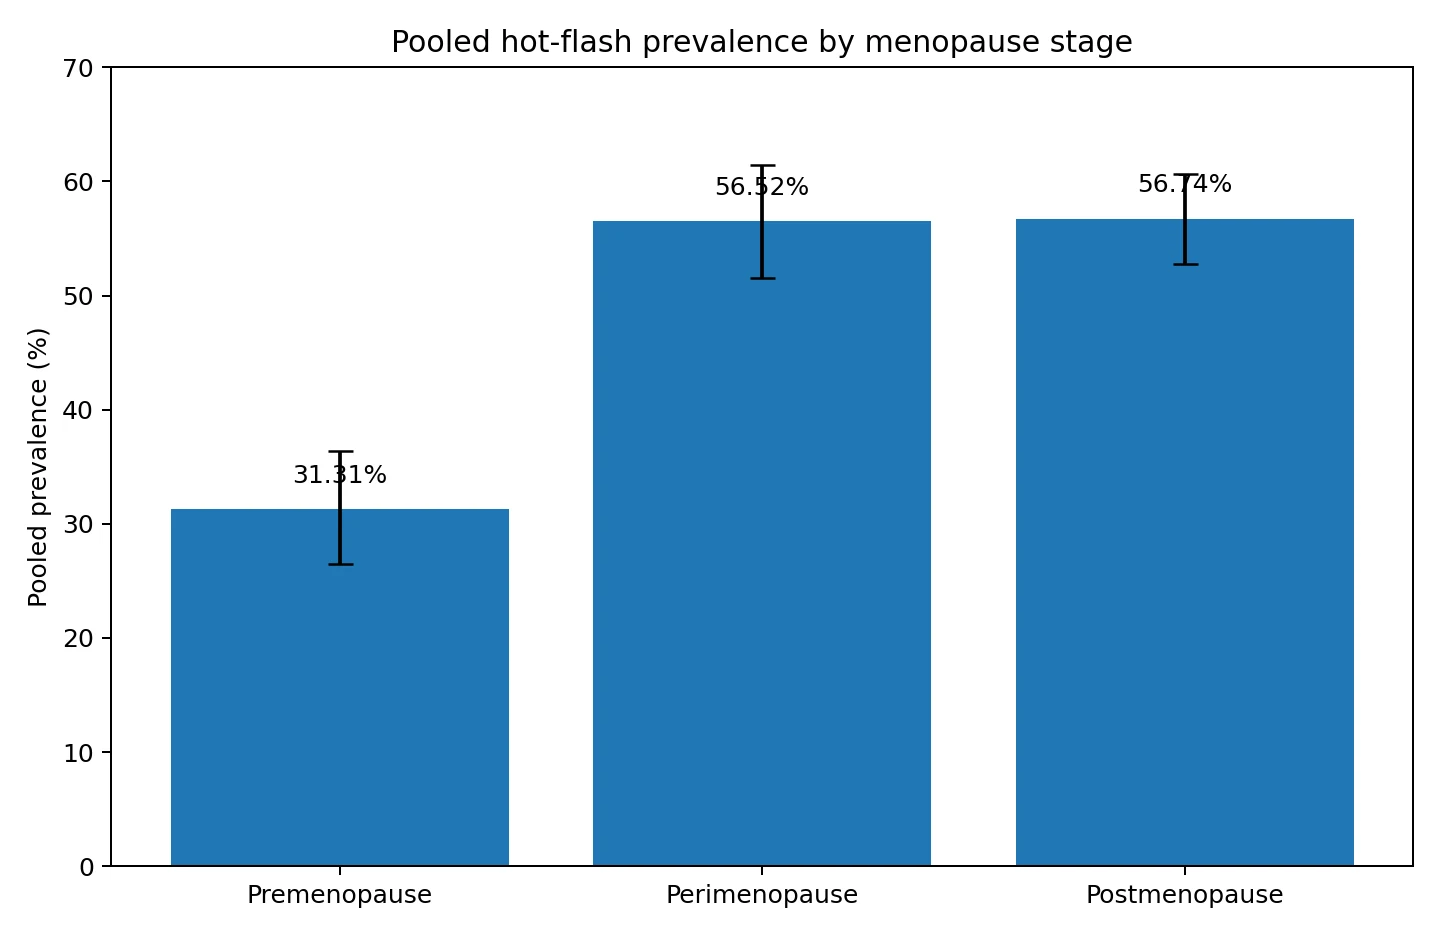
Chart source: Fang et al. 2024, Table 1. Visualization by The HRT Index; values are pooled subgroup estimates with published 95% confidence intervals.
Prevalence by geography, income, publication period, and questionnaire
| Category | Subgroup | Pooled prevalence | 95% CI |
|---|---|---|---|
| Continent | Africa | 64.43% | 56.78–71.73 |
| Continent | Oceania | 39.92% | 30.56–49.66 |
| Country, at least three studies | Egypt | 72.56% | 58.15–84.91 |
| Country, at least three studies | Finland | 14.54% | 5.82–26.29 |
| Country income | Low income | 65.93% | 59.61–71.98 |
| Country income | Upper-middle income | 54.72% | 50.08–59.31 |
| Country income | Lower-middle income | 54.17% | 49.57–58.73 |
| Country income | High income | 49.72% | 46.19–53.25 |
| Publication period | Before 2011 | 48.70% | 44.78–52.63 |
| Publication period | After 2011 | 55.48% | 52.51–58.43 |
| Measurement tool | 10-item Cervantes Scale | 69.95% | 53.70–83.96 |
| Measurement tool | Simplified Menopausal Index | 39.26% | 27.45–51.74 |
Source: Fang Y, Liu F, Zhang X, et al. BMC Public Health. 2024;24:1767, Table 1. Ecological and study-level subgroup estimates; no individual-level or causal inference. Last verified August 1, 2026.
The observed pooled spans were:
- 30.69 percentage points between the two measurement tools shown above.
- 24.51 points between Africa and Oceania.
- 16.21 points between low- and high-income country groups.
- 58.02 points between Egypt and Finland among countries represented by at least three studies.
The narrow, supportable conclusion is that the questionnaire-specific span exceeded the continent and income-group spans in this meta-analysis, but it did not exceed the country span. These are descriptive subgroup differences, not a causal hierarchy.
The meta-analysis also reported no statistically significant hot-flash subgroup difference for age (p = 0.69), physical activity (p = 0.82), BMI (p = 0.86), residence (p = 0.39), employment (p = 0.65), drinking (p = 0.76), smoking (p = 0.48), marital status (p = 0.14), or education (p = 0.71). That means these particular pooled subgroup tests did not detect differences under the review's methods. It does not erase associations reported in individual longitudinal studies.
Why do published hot flash statistics disagree so much?
Most apparent disagreements are denominator and definition problems. A prevalence estimate can change when the symptom, severity threshold, stage, recall window, or sampled population changes — even before any biological explanation enters the picture.
One recent study shows how much stage and threshold matter
The Australian Women's Midlife Years (AMY) Study surveyed women aged 40–69 and classified 5,509 participants using STRAW+10. Symptoms were measured with the Menopause-Specific Quality of Life questionnaire over the previous four weeks.
Moderately-to-severely bothersome hot flushes were reported by:
| Menopause stage | Participants | Prevalence | 95% CI |
|---|---|---|---|
| Premenopause | 1,250 | 8.8% | 7.2–10.4 |
| Late perimenopause | 271 | 37.3% | 31.5–43.0 |
Source: Islam RM, Bond M, Ghalebeigi A, et al. The Lancet Diabetes & Endocrinology. 2025;13:765–776. Four-week, moderately-to-severely bothersome hot-flush measure. Last verified August 1, 2026.
The HRT Index calculation: the cross-sectional difference was 28.5 percentage points. The study's adjusted prevalence ratio was 4.74 (95% CI 3.64–6.19).
That is a strong stage association for this exact outcome. It is not a within-person increase, a lifetime prevalence figure, or the prevalence of any hot flash at any severity.
The denominator translator
Any hot-flash statistic can be located on seven axes. Two figures are directly comparable only when those axes align closely enough to answer the same question.
| Dimension | Common definitions |
|---|---|
| Symptom scope | Hot flashes only · night sweats only · combined vasomotor symptoms |
| Severity threshold | Any · bothersome · moderate · severe · frequent |
| Time frame | Current month · previous two weeks · previous four weeks · past year · whole transition |
| Population | General population · staged cohort · current sufferers · treatment seekers · app users · trial entrants |
| Metric | Prevalence · cumulative experience · episodes per day · minutes per episode · years of symptoms |
| Design | Cross-sectional · longitudinal · meta-analysis · trajectory model · clinical trial |
| Instrument | MENQOL · Cervantes Scale · Simplified Menopausal Index · menstrual calendar · direct question · physiologic monitor |
Source: The HRT Index Hot Flash Statistics Evidence Atlas v1.0. Framework developed for this page from the source-native definitions recorded in the downloadable dataset.
Worked examples:
- 52.65% — pooled prevalence of hot flashes across mixed stages, instruments, and populations.
- 37.3% — moderately-to-severely bothersome hot flushes in late-perimenopausal Australian participants over four weeks.
- 63.9% — moderate-to-severe VMS in a self-selected menopause-app sample under that study's threshold.
- 9.0 per day — arithmetic on severity-band means among women reporting daytime hot flashes every day.
- 7.4 years — median duration of frequent combined VMS in SWAN.
When do hot flashes start, and when do they peak?
In the SWAN Menstrual Calendar substudy, about 20% of women reported hot flashes in a given month several years before their final menstrual period. Reporting began rising about four years before it, reached about 48% in the year before, and rose to about 60% in the year after — then declined gradually rather than stopping.
The study followed 955 participants who recorded symptom occurrence on monthly calendars over a ten-year period. Prospective monthly recording reduces the long retrospective recall required by studies that ask participants to reconstruct years of symptoms later, although the symptom reports were still self-reported.
| Time relative to the final menstrual period | Approximate share reporting hot flashes that month |
|---|---|
| Five to eight years before | ~20% |
| About four years before | Prevalence began rising |
| Year before | ~48% |
| Year after | ~60% |
| Later postmenopause | Declined gradually |
Source: Harlow SD, Elliott MR, Bondarenko I, Thurston RC, Jackson EA. Menopause. 2020;27(1):5–13. Approximate landmarks reported in the Results and figures. Last verified August 1, 2026.
The abstract describes the early baseline as five to ten years before the final menstrual period, while the Results use five to eight years and the Methods say observations more than eight years before were excluded because data were sparse. This page uses five to eight years, the range that matches the stated analytic window.
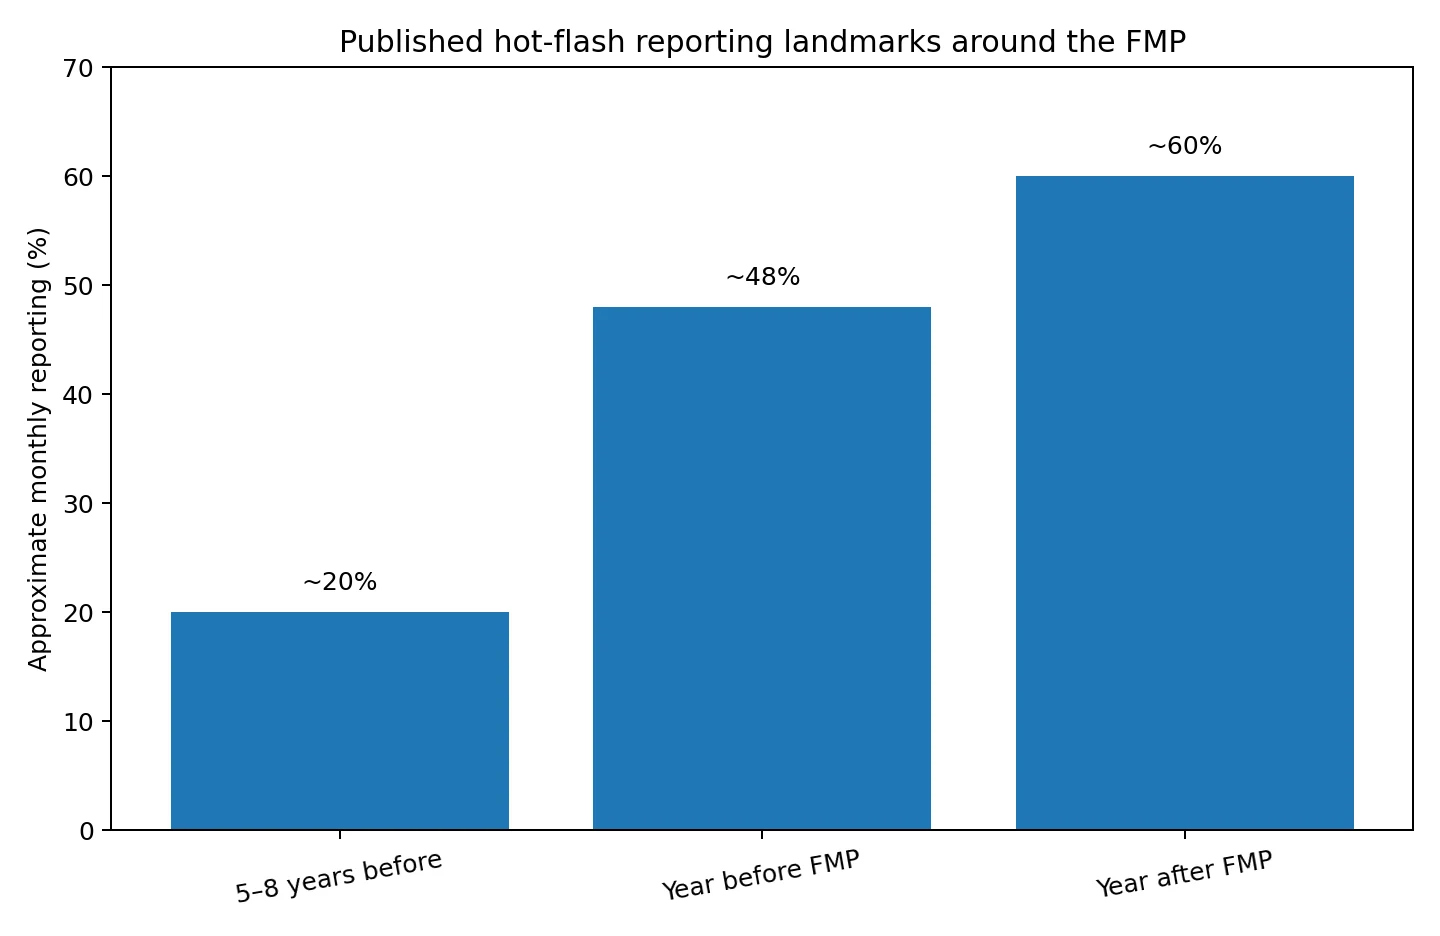
Chart source: Harlow et al. 2020. The three plotted values are published approximate landmarks, not an interpolated annual series.
Seasonality
Hot-flash reporting peaked in July and troughed in January. The odds of reporting a hot flash in a given month were 66% greater at the modeled seasonal peak than at the seasonal minimum. Night sweats and trouble sleeping showed corresponding peak-versus-minimum odds differences of 50% and 24%.
That is an odds comparison. It is not a 66-percentage-point increase in prevalence, and it cannot be converted into one without the relevant baseline probability.
The same study reported associations with current smoking and hormone-therapy use. Current smoking was associated with higher odds of monthly hot-flash reporting (OR 2.48, 95% CI 1.41–4.36). Hormone-therapy use was associated with lower odds before the final menstrual period (OR 0.58, 95% CI 0.45–0.75) and after it (OR 0.10, 95% CI 0.06–0.15). These are observational associations inside this cohort, not randomized treatment effects.
Primary source: Harlow SD, Elliott MR, Bondarenko I, et al. Monthly variation of hot flashes, night sweats, and trouble sleeping.
How many hot flashes a day is typical?
There is no defensible universal daily average. Among U.S. peri- and postmenopausal women who reported current hot flashes in the U.S. Menopause Epidemiology Study, 62.5% reported one or two on a symptomatic day, 23.5% reported three or four, 7.9% reported five or six, and 6.1% reported seven or more.
The source was an online survey of a nationally representative sample of 4,402 U.S. women aged 40–65, fielded in April 2005 and published in 2008. Detailed frequency questions went to peri- and postmenopausal participants reporting current symptoms, so the tables below describe current sufferers, not all women.
Days with hot flashes in the previous four weeks
Denominator: 1,726 peri- and postmenopausal women reporting current hot flashes.
| Frequency | Share |
|---|---|
| One to three days in four weeks | 29.1% |
| One to two days per week | 20.2% |
| Three to four days per week | 18.2% |
| Five to six days per week | 8.9% |
| Every day | 23.7% |
Source: The HRT Index Editorial Team; see the primary sources linked in this section.
Number of hot flashes on a symptomatic day
Denominator: 1,827 women answering how many they typically had on days when hot flashes occurred.
| Episodes on a symptomatic day | Share |
|---|---|
| One to two | 62.5% |
| Three to four | 23.5% |
| Five to six | 7.9% |
| Seven or more | 6.1% |
Source: Source for both tables: Williams RE, Kalilani L, DiBenedetti DB, et al. Climacteric. 2008;11:32–43. The four-week frequency column sums to 100.1% because of rounding. Last verified August 1, 2026.
The HRT Index calculations from the published distributions:
- 32.6% had hot flashes on at least five days per week: 8.9 + 23.7.
- 37.5% reported at least three on a symptomatic day: 23.5 + 7.9 + 6.1.
- 14.0% reported at least five on a symptomatic day: 7.9 + 6.1.
Where the nine-per-day figure comes from
Among the 405 women who reported daytime hot flashes every day, the published mean counts by severity band were 2.5 very mild or mild, 2.6 moderate, 2.5 severe, and 1.4 very severe.
2.5 + 2.6 + 2.5 + 1.4 = 9.0 mean daytime episodes across severity bandsThat is The HRT Index's arithmetic on the published means. It describes a daily-symptom subgroup. It is not the average woman's day and not the average across all current sufferers.
Among 289 women reporting night sweats every night, the paper separately reported mean counts of 2.4 moderate, 3.2 severe, and 2.7 very severe episodes on a typical night. Those values should not be added to the daytime figure or treated as a general nightly average.
Funding and affiliation disclosure: the study included authors affiliated with GlaxoSmithKline and RTI Health Solutions and was funded by GlaxoSmithKline. The source remains useful because it publishes the exact denominators and response distributions; the sponsorship belongs beside the evidence.
How long does a single hot flash last?
In the same U.S. survey, 43.4% of current sufferers said a typical episode lasted one to two minutes and 25.3% said three to five minutes. Another 20.3% reported less than a minute, while 11.0% reported more than five minutes.
Denominator: 1,834 peri- and postmenopausal women currently experiencing hot flashes.
| Typical episode length | Share |
|---|---|
| Less than one minute | 20.3% |
| One to two minutes | 43.4% |
| Three to five minutes | 25.3% |
| More than five minutes | 11.0% |
Source: Williams RE, Kalilani L, DiBenedetti DB, et al. Climacteric. 2008;11:32–43. Last verified August 1, 2026.
The HRT Index calculation: 68.7% reported a typical episode lasting one to five minutes: 43.4 + 25.3.
That agrees with the one-to-five-minute range used in The Menopause Society's patient reference, but the distribution is more informative than the range. About one in five respondents said a typical episode ended in under a minute, and 11.0% said it ran longer than five minutes.
How many years do hot flashes last?
Published duration estimates answer sharply different questions. Two major longitudinal medians are 7.4 years for frequent combined vasomotor symptoms in SWAN and 10.2 years for moderate-to-severe hot flushes in the Penn Ovarian Aging Study. A much shorter 2.5-year mean comes from a selected subgroup whose hot flashes had already ended.
| Figure | Statistic | What was counted | Estimator and population | Source |
|---|---|---|---|---|
| >11.8 years | Median lower bound | Frequent VMS beginning in premenopause or early perimenopause | Survival analysis in SWAN | Avis et al. 2015 |
| >11.57 years | Median lower bound | Moderate-to-severe hot flushes beginning near entry to the transition | Survival analysis, Penn cohort | Freeman et al. 2011 |
| 10.2 years | Median | Moderate-to-severe hot flushes | Survival analysis, n=259 | Freeman et al. 2011 |
| 9.4 years | Median | Post-FMP persistence after premenopausal or early-perimenopausal onset | Survival analysis in SWAN | Avis et al. 2015 |
| 7.4 years | Median | Frequent VMS: hot flashes or night sweats on at least six of the previous fourteen days | Survival analysis, n=1,449 | Avis et al. 2015 |
| 6.0 years; median 4.0 | Mean and median observed duration at study time | All women in the Smith cohort with hot flashes, including symptoms not yet ended | Descriptive, right-censored observations included | Smith et al. 2016 |
| 4.9 years | Mean after FMP | Any hot flashes after the final menstrual period | Annual follow-up, n=255 | Freeman et al. 2014 |
| 4.6 years | Mean after FMP | Moderate-to-severe hot flashes after the final menstrual period | Annual follow-up, n=255 | Freeman et al. 2014 |
| 4.5 years | Median | Frequent VMS persisting after the final menstrual period | Survival analysis, n=881 | Avis et al. 2015 |
| 3.84 years | Median | Moderate-to-severe hot flushes beginning in late transition or postmenopause | Survival analysis, Penn cohort | Freeman et al. 2011 |
| 3.4 years | Median | Frequent VMS beginning after menopause | Survival analysis in SWAN | Avis et al. 2015 |
| 2.5 years; median 1.0 | Mean and median | Only women who reported that hot flashes had ended, n=238 | Descriptive ended-symptom subgroup | Smith et al. 2016 |
Source: The HRT Index Hot Flash Statistics Evidence Atlas v1.0, compiled from Avis 2015, Freeman 2011, Freeman 2014, and Smith 2016. The rows use different symptom thresholds, cohorts, time origins, and estimators and should not be treated as interchangeable estimates.
Why 2.5 years and 10.2 years can both appear
The 2.5-year figure is a mean, not a median. It describes only the 238 women in the Midlife Women's Health Study who reported that their hot flashes had ended. The Results section gives a one-year median for that subgroup. Women still having hot flashes at study close cannot enter the already-ended group, which selects against the longest ongoing durations.
The same paper reports a six-year mean and four-year median among all women experiencing hot flashes at the time of analysis, including women whose symptoms had not ended.
Freeman and Avis used survival methods designed to account for censored observations — women whose symptoms were still continuing or whose exact stop time was not observed. Their estimates answer a different question from a simple summary of the subgroup whose symptoms had already ended.
No method is rescued by stripping away its denominator. “Mean duration among women whose symptoms had ended” and “survival-estimated median duration of moderate-to-severe or frequent symptoms” are not interchangeable claims.
Primary source: Smith RL, Gallicchio L, Miller SR, et al. Risk Factors for Extended Duration and Timing of Peak Severity of Hot Flashes. PLOS ONE. 2016.
What the two large longitudinal cohorts agree on
Earlier onset was associated with longer duration.
In SWAN, frequent VMS beginning in premenopause or early perimenopause lasted a median of more than 11.8 years and persisted a median 9.4 years after the final menstrual period. Symptoms first reported after menopause lasted a median 3.4 years.
The HRT Index calculation: the early-onset median lower bound exceeded the postmenopausal-onset median by more than 8.4 years and was more than 3.47 times as large.
The Penn cohort produced a notable independent convergence at the late-onset end: a median 3.84 years for moderate-to-severe hot flushes beginning in late transition or postmenopause, compared with 3.4 years in SWAN for frequent VMS beginning after menopause. The definitions differ, so the estimates should not be merged, but their proximity is worth seeing.
The duration studies also challenged then-common expectations that vasomotor symptoms usually lasted only months to a few years. Their data did not support one short, uniform course.
Primary sources: Avis et al. 2015; Freeman et al. 2011; Freeman et al. 2014.
Does everyone follow the same pattern?
No. A SWAN trajectory analysis of 1,455 women followed for a median of 15.4 years identified four distinct model-derived patterns: persistently low, early onset, late onset, and persistently high. There was no single course followed by most participants.
| Trajectory | Share of analytic sample | Pattern |
|---|---|---|
| Persistently low | 27.0% | Low probability throughout, with a small rise near the final menstrual period |
| Early onset | 18.4% | Began about eleven years before the final menstrual period and declined after menopause |
| Late onset | 29.0% | Rose near the final menstrual period and declined later |
| Persistently high | 25.6% | Began early and remained high across much of the observed transition |
Source: Tepper PG, Brooks MM, Randolph JF Jr, et al. Menopause. 2016;23(10):1067–1074. Group-based trajectory model using 1,455 women and 17,814 observations. Last verified August 1, 2026.
The HRT Index calculation: the three trajectories other than persistently low sum to 73.0% of this analytic sample: 18.4 + 29.0 + 25.6.
That must stay attached to the model. It does not mean “73% of all women have significant hot flashes,” and the trajectory labels are not diagnoses.
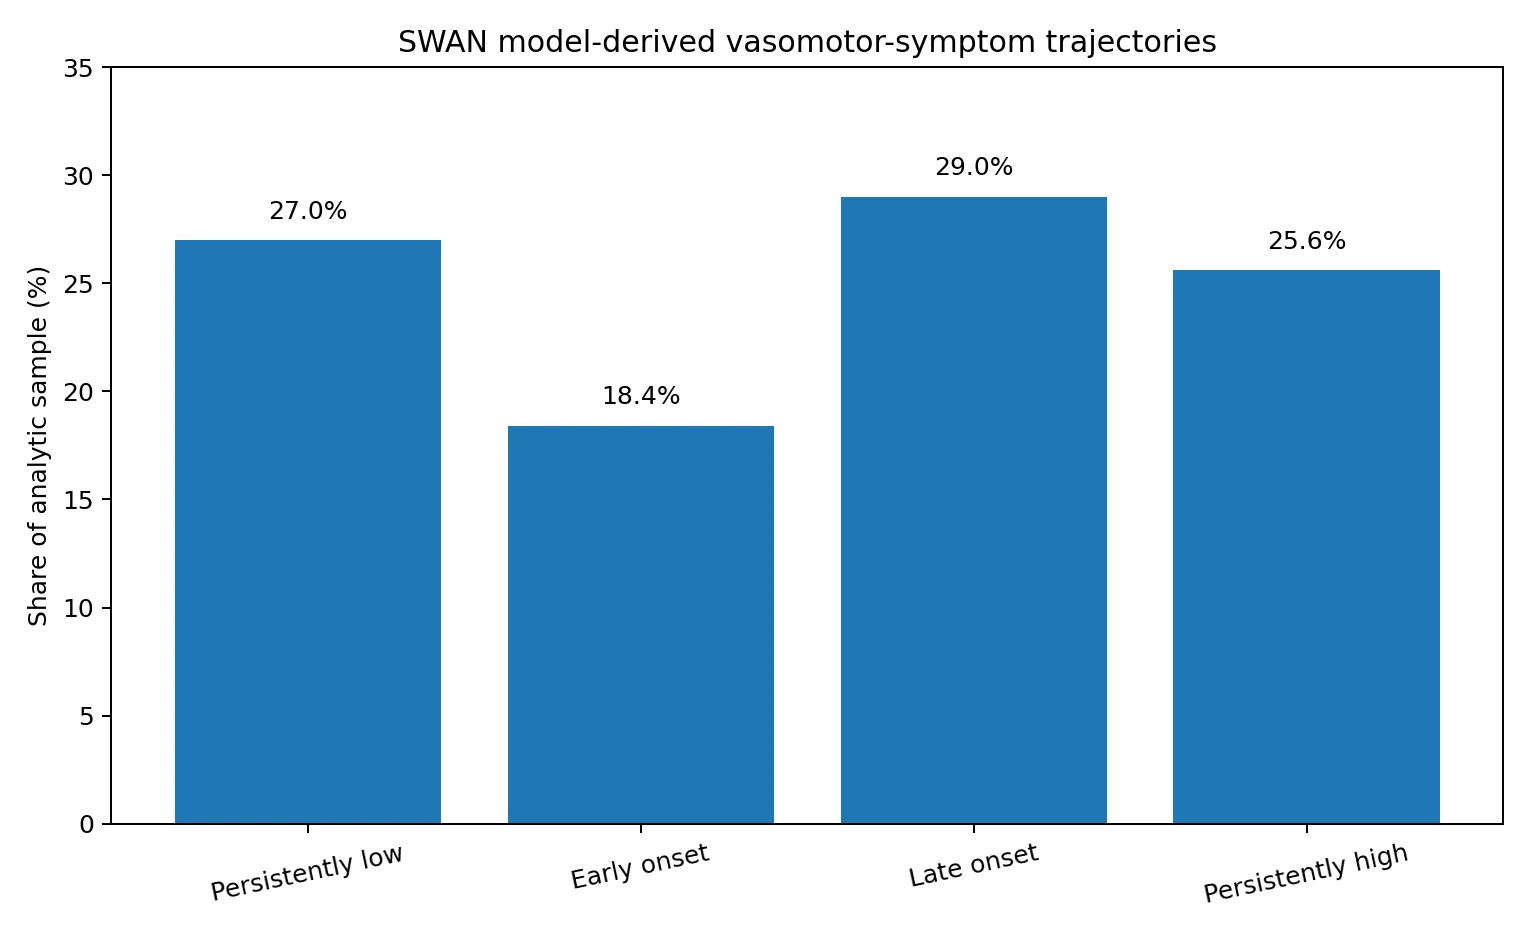
Chart source: Tepper et al. 2016. Visualization by The HRT Index from the published model-estimated group shares.
Primary source: Tepper PG, Brooks MM, Randolph JF Jr, et al. Characterizing the trajectories of vasomotor symptoms across the menopausal transition.
How is a hot flash measured?
Research studies commonly use self-report, diaries, questionnaires, or sternal skin-conductance monitoring. A 2011 systematic review found an overall exploratory concordance of 29% between self-report and sternal skin conductance, but variation between studies was too broad to identify one typical concordance rate.
| Measurement comparison | Reported concordance or reporting pattern |
|---|---|
| Overall exploratory concordance | 29% |
| Ambulatory monitoring | 29% |
| Nonambulatory or laboratory monitoring | 54% |
| Night sweats under-reported | 46% |
| Night sweats over-reported | 22% |
Source: Mann E, Hunter MS. Menopause. 2011;18(6):709–722. Systematic review and exploratory meta-analysis. Last verified August 1, 2026.
The review did not conclude that one measure made the other worthless. Its conclusion was that using both concurrently was likely to produce more reliable and valid measurement than either alone. The 29% figure also should not be presented as a universal error rate because the authors explicitly said variability was too broad for one typical rate.
The night-sweat studies in the review showed under-reporting more often than over-reporting. That finding applies to those included measurement comparisons; it is not a license to “correct” every self-reported prevalence upward.
Primary source: Mann E, Hunter MS. Concordance between self-reported and sternal skin conductance measures of hot flushes.
What do FDA trial thresholds show about severe symptoms?
The current FDA labels reviewed for this page include three nonhormonal prescription products specifically indicated for moderate-to-severe menopausal vasomotor symptoms: BRISDELLE (paroxetine 7.5 mg), VEOZAH (fezolinetant), and LYNKUET (elinzanetant). The table below compares the two neurokinin-antagonist programs because their pivotal-trial entry thresholds are close enough to make the denominator problem visible.
| Trial-program feature | VEOZAH (fezolinetant) | LYNKUET (elinzanetant) |
|---|---|---|
| Mechanism in current label | NK3 receptor antagonist | NK1 and NK3 receptor antagonist |
| Label version reviewed | 12/2024, FDA Reference ID 5497306 | 10/2025, FDA Reference ID 5683116 |
| Pivotal efficacy trials | NCT04003155 and NCT04003142 | OASIS 1 and OASIS 2 |
| Women randomized | 1,022 | 796 |
| Entry threshold | Minimum average 7 moderate-to-severe VMS per day | At least 50 moderate-to-severe hot flashes per week, including nighttime episodes |
| Published baseline frequency by arm | 10.4, 10.5, 11.8, 11.6 per 24 hours | 13.38, 14.26, 14.66, 16.16 per 24 hours |
| Mean age | 54 years | 54.6 years |
| Label's clinically meaningful frequency language | Reduction of at least two hot flashes over 24 hours | Reduction of at least two hot flashes over 24 hours |
Source: Current FDA prescribing information for VEOZAH, LYNKUET, and BRISDELLE. This table describes trial populations and label language, not comparative effectiveness. Last verified August 1, 2026.
The entry thresholds differ by one episode per week: 49 versus 50, a 2.04% difference.
Using an unweighted mean of the four printed baseline arm means gives approximately 11.08 episodes per 24 hours for the VEOZAH trials and 14.62 for the LYNKUET trials. The second descriptive average is about 32.0% higher.
That calculation does not compare treatment effects. It shows that near-identical minimum entry thresholds can still produce trial populations with different observed baseline frequencies. “Moderate-to-severe VMS” is a study rule, not one uniform population.
Both labels describe a reduction of at least two hot flashes over 24 hours as clinically meaningful within their pivotal programs. That is label-specific trial language, not a universal threshold for every patient or every study.
For the treatment and monitoring details that do not belong in a statistics atlas, see the independent Nonhormonal Hot Flash Reference.
Can hot flashes occur outside natural menopause?
Yes. Hot flashes can also follow cancer treatment that suppresses sex hormones, including androgen-deprivation therapy for prostate cancer and endocrine therapy for breast cancer. These populations should not be folded into natural-menopause prevalence estimates, but they belong in a complete hot-flash evidence map.
| Population and study | Result | Exact denominator or scope | What it supports |
|---|---|---|---|
| Men receiving short-course androgen-deprivation therapy before prostate SBRT | Cumulative bothersome-hot-flash incidence 52.4% | Retrospective series, n=122 | Hot flashes were common during testosterone suppression and fell as testosterone recovered |
| Same series | 2% at baseline, 45% at SBRT start, 2% nine months after SBRT | Time-specific prevalence in the same cohort | Symptoms changed over the treatment and recovery timeline |
| Men receiving androgen-deprivation therapy in a prospective single-institution study | 20.0% none; 68.4% mild-to-moderate; 11.6% severe | n=250 | Severity distribution in that treatment population |
| Breast-cancer patients receiving tamoxifen or aromatase inhibitors | Observational prevalence 32.5%–82.9%; interventional-study incidence 2%–60% | Systematic review of 37 studies published from 2010 through January 2023 | Published estimates vary widely by treatment, study, and measurement |
| Breast-cancer treatment studies reporting daily frequency | 2–20 episodes per day | Four studies within the same review | Frequency range in the included treatment-induced VMS literature |
Source: Shah et al. 2024, PMID 38586683; Challapalli et al. 2018; Morga A, Shiozawa A, Todorova L, et al. J Clin Med. 2025;14:2601. These are treatment-specific populations, not natural-menopause prevalence estimates.
The breast-cancer systematic review was authored by employees of Astellas Pharma and a contract research organization; Astellas markets fezolinetant. The review is useful because it aggregates a scattered evidence base, and the commercial connection belongs beside the numbers.
The prostate-cancer studies show why “hot flashes are a menopause symptom” is too narrow. They are vasomotor events associated with sex-steroid suppression in more than one clinical setting.
Where the most-repeated hot flash statistics come from
Several widely repeated figures lose precision as they move from one page to another. We checked the citation chain rather than inheriting the wording.
“Up to 80%”
The Menopause Society currently says that hot flashes and night sweats occur in up to 80% of women during menopause. Kronenberg's 1990 review is an early source cited by later SWAN papers that use upper-bound prevalence language.
The safe wording is “up to 80%” for hot flashes and night sweats in broad clinical context. It is a ceiling, not a pooled central estimate, and it should not be silently converted into “80% of women have hot flashes.”
A prevalence claim tied to a source that does not measure hot flashes
Smith et al. 2016 opens by saying approximately 75% of perimenopausal women experience hot flashes and cites reference 1. In the published reference list, reference 1 is the United States Census 2000 website.
The Census does not measure hot-flash prevalence. This appears to be a miscitation or reference-numbering error, not evidence that the paper's own duration data are invalid. It is still a clean example of why a familiar number needs its original denominator, not merely a nearby citation marker.
Primary source: Smith et al. 2016, Introduction and reference list.
Abstracts and Results sections can disagree
The Smith 2016 abstract gives a hot-flash duration range of 1–33 years. The Results section gives 1–29 years for the 238 women who reported that their symptoms had ended.
The Harlow 2020 abstract describes the early baseline window as five to ten years before the final menstrual period. The Results use five to eight years, and the Methods say observations more than eight years before were excluded because data were sparse.
Neither discrepancy requires guessing. This page reports the more specific Results/Methods framing and records the abstract wording in the source notes.
What this data shows — and what it does not
What it shows
Hot flashes are common across menopause-stage populations. In longitudinal SWAN calendar data, monthly reporting rose sharply around the final menstrual period, from about 20% several years before to about 60% in the year after.
For women who develop frequent or moderate-to-severe symptoms, the timescale can be years rather than months. Earlier onset was associated with longer duration in both SWAN and the Penn Ovarian Aging Study.
There is no single normal course. SWAN identified four model-derived trajectories with different timing and persistence. The statistic reported also depends heavily on the symptom definition, severity threshold, recall window, measurement instrument, study population, and estimator.
What it does not show
It does not give an individual reader a personal probability. It does not establish that menopause is the cause of every episode of heat, sweating, flushing, or nighttime waking. It does not diagnose perimenopause, determine whether treatment is needed, or identify which treatment is appropriate.
The geographic, income, publication-period, demographic, and trial-program comparisons are observational, ecological, or descriptive. Group averages describe groups. They do not determine individuals, establish fixed biological differences, or prove why one estimate exceeds another.
This page is educational research. Anyone with new, severe, persistent, or concerning symptoms should discuss them with a qualified clinician who can consider causes other than menopause.
How we built the Hot Flash Statistics Evidence Atlas
Source hierarchy. We prioritized peer-reviewed systematic reviews, original longitudinal cohorts, original population surveys, and current FDA prescribing information. A professional-society page was used only for current clinical context. When a secondary summary and the originating paper differed, the originating paper controlled.
Inclusion rule. A number entered the Atlas only when we could identify the population, symptom scope, severity threshold, recall window, denominator or analytic sample, metric type, and source. Figures whose original denominator could not be established were excluded.
Symptom normalization. Each row is coded as hot flashes alone, night sweats alone, or combined vasomotor symptoms. Combined VMS figures are never relabeled as hot-flash-only estimates.
Severity normalization. Any, bothersome, moderate, severe, and frequent symptoms remain separate. A severity-qualified prevalence is not presented as prevalence of any symptom.
Time normalization. Point prevalence, recall-window prevalence, monthly reporting, transition-wide experience, episodes per day, minutes per episode, and years of recurring symptoms are separate metrics.
Source-native estimators. Means, medians, odds ratios, prevalence ratios, modeled trajectory shares, and pooled estimates retain their original labels. We do not call a mean a median, turn odds into percentage points, or average incompatible duration estimates.
Calculations. Every value labeled “The HRT Index calculation” is arithmetic on published inputs. The formula, source rows, and limitation are recorded in the calculation file. We did not perform a new meta-analysis, recalculate published confidence intervals, or impute missing values.
Comparability. Each data row is marked compatible within source, conditionally comparable, not directly comparable, selected-sample only, or context only. A comparability flag explains whether two numbers answer a sufficiently similar question; it is not a quality grade.
Funding and conflicts. Commercial funding or author affiliations are recorded when they matter to interpretation. A disclosed conflict does not automatically invalidate a study, and omission of that conflict would make the evidence map weaker.
Verification. Every row and calculation in version 1.0 was checked against the source available on August 1, 2026. Future releases will use new versioned files. Version 1.0 will not be overwritten, so a previously used figure can be reconstructed.
Limitations
- The pooled prevalence estimate is extremely heterogeneous. I² = 99.51%, and the meta-analysis authors rated the symptom-prevalence evidence as very low certainty under GRADE. The 52.65% figure is a pooled summary, not a precise universal rate.
- Hot flashes and vasomotor symptoms are not always the same measure. Several major longitudinal studies define VMS as hot flashes or night sweats. Those results answer duration and trajectory questions, but they remain labeled as combined VMS.
- Self-report and physiological monitoring do not align consistently. The 2011 review found 29% exploratory overall concordance, but study-to-study variation was too broad to define one typical rate.
- Recall windows vary. Depending on the study, participants reported symptoms over a day, two weeks, four weeks, a calendar month, repeated annual visits, or recalled age at symptom onset.
- The detailed U.S. frequency and episode-length data are old. They were collected in April 2005 and answered by selected current sufferers. The exact distributions remain unusually useful, but they are not a 2026 population estimate.
- Selected samples can produce high estimates. The 2026 Spanish app study was a cross-sectional convenience sample of people who had already registered with a menopause app. Its 77.4% VMS and 63.9% moderate-to-severe VMS estimates should not be applied to Spain's general population.
- The AMY study was cross-sectional. Its 8.8% and 37.3% estimates compare different menopause-stage groups; they do not follow the same women from premenopause into late perimenopause. The study aimed to produce national estimates but recruited participants through a non-probability panel.
- Stage subgroups differ in size. AMY included 1,250 premenopausal participants but 271 in late perimenopause, which affects precision.
- Trajectory groups are statistical models. They are descriptions of patterns in one analytic cohort, not clinical diagnoses or fixed paths assigned to every individual.
- The SWAN calendar substudy may underrepresent highly symptomatic hormone-therapy users. Women whose final menstrual period could not be observed because of hormone therapy were excluded. The calendar recorded symptom occurrence, not severity.
- The duration table intentionally does not produce one average. The rows use different thresholds, time origins, populations, and estimators. Averaging them would create a number with no coherent denominator.
- FDA trial-population comparisons are descriptive. The baseline-frequency calculation does not compare the effectiveness or safety of VEOZAH and LYNKUET and is not adjusted for differences between the trials.
- Treatment-induced populations are separate. Prostate- and breast-cancer treatment studies should not be combined with natural-menopause prevalence data.
- This is an evidence compilation, not a new clinical study. Its original contribution is denominator normalization, source reconciliation, calculation disclosure, and versioned data — not newly collected patient outcomes.
- This page is not medical advice. It does not diagnose the cause of a symptom or replace care from a licensed clinician.
Frequently asked questions
What percentage of women get hot flashes?
The broadest recent pooled estimate identified in this review is 52.65%, from 265 hot-flash articles covering 349,608 middle-aged women. The analysis had I² = 99.51% and very-low GRADE certainty, so the figure is a pooled summary of highly variable studies rather than a personal probability.
How many hot flashes per day is typical?
There is no universal daily number. Among U.S. peri- and postmenopausal women with current hot flashes in a survey fielded in 2005, 62.5% reported one or two on a symptomatic day, 23.5% reported three or four, and 6.1% reported seven or more.
How long does one hot flash last?
In that same survey, 43.4% of current sufferers said a typical episode lasted one to two minutes and 25.3% said three to five minutes. Another 20.3% reported less than a minute and 11.0% more than five minutes, so 68.7% fell in the one-to-five-minute range.
How many years do hot flashes last?
In SWAN, frequent vasomotor symptoms — hot flashes or night sweats on at least six of the previous fourteen days — lasted a median 7.4 years and persisted a median 4.5 years after the final menstrual period. The Penn Ovarian Aging Study estimated a median 10.2 years for moderate-to-severe hot flushes. The figures use different cohorts, thresholds, and estimators.
When are hot flashes most common?
A SWAN menstrual-calendar analysis found monthly reporting rising from about 20% five to eight years before the final menstrual period to about 48% in the year before and about 60% in the year after, followed by a gradual decline.
Can hot flashes start before periods stop?
Yes. About 20% of participants in the SWAN calendar substudy reported hot flashes in a given month five to eight years before their final menstrual period. A hot flash by itself does not establish that perimenopause has begun or identify its cause.
Do hot flashes vary by season?
In the SWAN calendar data, reporting peaked in July and troughed in January. The odds of reporting a hot flash were 66% greater at the modeled seasonal peak than at the seasonal minimum. That is an odds comparison, not a 66-percentage-point increase.
Why do studies report different hot-flash percentages?
Because they count different things. A study may count hot flashes alone or combined VMS, any symptom or only bothersome symptoms, a general population or current sufferers, one month or an entire transition, and prevalence or duration. The denominator and definition have to travel with the number.
Can men get hot flashes?
Yes. Hot flashes occur in some men receiving androgen-deprivation therapy for prostate cancer. In one 122-patient series, the cumulative incidence of bothersome hot flashes was 52.4%; in another 250-patient study, 11.6% reported severe hot flashes.
Which hot-flash statistic fits which claim?
For pooled prevalence, use 52.65% with 265 articles, 349,608 women, the 95% confidence interval, I², and the very-low certainty rating. For timing around the final menstrual period, use the SWAN calendar landmarks. For daily frequency and episode length, use the Williams distributions and state that the denominator is current sufferers. For duration, name the symptom threshold and use either the 7.4-year SWAN median or the 10.2-year Penn median rather than blending them.
Primary sources
- Fang Y, Liu F, Zhang X, Chen L, Liu Y, Yang L, Zheng X, Liu J, Li K, Li Z. Mapping global prevalence of menopausal symptoms among middle-aged women: a systematic review and meta-analysis. BMC Public Health. 2024;24:1767. doi:10.1186/s12889-024-19280-5. PROSPERO CRD42023486818. Role: pooled prevalence; stage, geography, income, period, and instrument subgroups.
- Avis NE, Crawford SL, Greendale G, et al.; Study of Women's Health Across the Nation. Duration of menopausal vasomotor symptoms over the menopause transition. JAMA Internal Medicine. 2015;175(4):531–539. doi:10.1001/jamainternmed.2014.8063. Role: frequent-VMS duration and onset timing.
- Freeman EW, Sammel MD, Lin H, Liu Z, Gracia CR. Duration of menopausal hot flushes and associated risk factors. Obstetrics & Gynecology. 2011;117(5):1095–1104. doi:10.1097/AOG.0b013e318214f0de. Role: moderate-to-severe hot-flush duration.
- Freeman EW, Sammel MD, Sanders RJ. Risk of long-term hot flashes after natural menopause: evidence from the Penn Ovarian Aging Study cohort. Menopause. 2014;21(9):924–932. doi:10.1097/GME.0000000000000196. Role: post-FMP prevalence and duration.
- Harlow SD, Elliott MR, Bondarenko I, Thurston RC, Jackson EA. Monthly variation of hot flashes, night sweats, and trouble sleeping: effect of season and proximity to the final menstrual period in the SWAN Menstrual Calendar substudy. Menopause. 2020;27(1):5–13. doi:10.1097/GME.0000000000001420. Role: timing around the final menstrual period and seasonality.
- Tepper PG, Brooks MM, Randolph JF Jr, et al. Characterizing the trajectories of vasomotor symptoms across the menopausal transition. Menopause. 2016;23(10):1067–1074. doi:10.1097/GME.0000000000000676. Role: trajectory heterogeneity.
- Islam RM, Bond M, Ghalebeigi A, Wang Y, Walker-Bone K, Davis SR. Prevalence and severity of symptoms across the menopause transition: cross-sectional findings from the Australian Women's Midlife Years Study. The Lancet Diabetes & Endocrinology. 2025;13:765–776. doi:10.1016/S2213-8587(25)00138-X. Role: stage-specific bothersome hot-flush prevalence.
- Williams RE, Kalilani L, DiBenedetti DB, Zhou X, Granger AL, Fehnel SE, Levine KB, Jordan J, Clark RV. Frequency and severity of vasomotor symptoms among peri- and postmenopausal women in the United States. Climacteric. 2008;11:32–43. doi:10.1080/13697130701744696. Role: frequency and episode-length distributions.
- Mann E, Hunter MS. Concordance between self-reported and sternal skin conductance measures of hot flushes in symptomatic perimenopausal and postmenopausal women: a systematic review. Menopause. 2011;18(6):709–722. doi:10.1097/gme.0b013e318204a1fb. Role: measurement concordance.
- Coronado PJ, Mendoza N, González SP, et al. Prevalence of vasomotor symptoms and the associated risk factors: the “Mi Menopausia” app study. Maturitas. 2026;209:108958. doi:10.1016/j.maturitas.2026.108958. Role: selected app-sample prevalence.
- Smith RL, Gallicchio L, Miller SR, Zacur HA, Flaws JA. Risk factors for extended duration and timing of peak severity of hot flashes. PLOS ONE. 2016;11(5):e0155079. doi:10.1371/journal.pone.0155079. Role: descriptive duration and citation-provenance audit.
- Kronenberg F. Hot flashes: epidemiology and physiology. Annals of the New York Academy of Sciences. 1990;592:52–86. Role: early source behind widely repeated upper-bound prevalence language.
- U.S. Food and Drug Administration. Prescribing information for VEOZAH, rev. 12/2024, Reference ID 5497306; LYNKUET, rev. 10/2025, Reference ID 5683116; and BRISDELLE, current 2025 label, Reference ID 5528764. Role: current indications, entry thresholds, trial populations, and label language.
- Shah S, Pepin A, Jatar S, et al. Bothersome hot flashes following neoadjuvant androgen deprivation therapy and stereotactic body radiotherapy for localized prostate cancer. Cureus. 2024;16(3):e55729. doi:10.7759/cureus.55729. PMID 38586683. Role: time-specific and cumulative bothersome-hot-flash incidence in men receiving short-course ADT.
- Challapalli A, Edwards SM, Abel P, Mangar SA. Evaluating the prevalence and predictive factors of vasomotor and psychological symptoms in prostate cancer patients receiving hormonal therapy: results from a single institution experience. Clinical and Translational Radiation Oncology. 2018;10:29–35. doi:10.1016/j.ctro.2018.03.002. Role: vasomotor-symptom severity distribution in a prospective prostate-cancer treatment cohort.
- Morga A, Shiozawa A, Todorova L, Ajmera M, Arregui M, Wissinger E. The burden of illness of treatment-induced vasomotor symptoms in individuals with breast cancer: a systematic literature review. Journal of Clinical Medicine. 2025;14:2601. doi:10.3390/jcm14082601. Role: breast-cancer endocrine-therapy prevalence and frequency ranges; commercial affiliations disclosed above.
- The Menopause Society. Hot Flashes. Role: current professional-society context for the up-to-80% and one-to-five-minute summaries.
How to cite this page
The HRT Index Editorial Team. “Hot Flash Statistics: 2026 Data on
Prevalence, Frequency, and Duration.” The HRT Index Research.
Dataset: Hot Flash Statistics Evidence Atlas, version 1.0.
Published and last verified August 1, 2026.
https://thehrtindex.com/research/hot-flash-statistics/
Data downloads and version history
- Evidence Atlas CSV: /research/data/hot-flash-statistics-atlas-v1.csv
- Evidence Atlas JSON: /research/data/hot-flash-statistics-atlas-v1.json
- Calculation record: /research/data/hot-flash-statistics-atlas-v1-calculations.csv
- Data dictionary: /research/data/hot-flash-statistics-atlas-v1-data-dictionary.csv
Version 1.0 — August 1, 2026. Initial publication. Source-native denominators, symptom definitions, thresholds, recall windows, estimators, conflicts, safe wording, and formulas were recorded for every included row.
Future releases will use new stable versioned URLs. Version 1.0 will not be overwritten.
About this research
The HRT Index Research is the independent research and reference section of The HRT Index. This page was produced by extracting published hot-flash statistics, normalizing them by denominator and definition, and checking them against their originating sources. It contains no provider comparisons, product recommendations, affiliate links, lead forms, or paid placements.
The HRT Index earns referral commissions from menopause and hormone-therapy providers elsewhere on the site. It earns none from this page. That distinction is stated because readers are entitled to apply the same scrutiny to this publisher that this page applies to every other source.
Related research: Menopause Diagnosis Statistics · Menopause Racial Disparities · Nonhormonal Hot Flash Reference