Menopause Market Size: What Current Data Shows in 2026
By The HRT Index Editorial Team · Editorial research — not medically reviewed Last verified: August 3, 2026 · Dataset version: 1.0
The HRT Index Research is the site's research and reference section on menopause and hormone therapy.
The finding
Published menopause market size estimates do not converge on one figure. We normalized four current public estimates to the same calendar year and got a 2026 range of $19.26 billion to $20.93 billion, with an unweighted median of $19.83 billion. PwC, using a different cross-sector model, separately estimated the category at roughly $10 billion to $15 billion in May 2026. And the $600 billion figure cited in menopause business coverage is not annual revenue. It is a 2020 addressable-opportunity claim whose publicly described inputs multiply to $2 trillion, not $600 billion.
Quotable summary: “Four public global menopause-market estimates normalize to a 2026 median of $19.83 billion, within a $19.26–$20.93 billion range. But the apparent agreement is deceptive: Grand View Research and Straits Research differ by only $0.39 billion in their 2025 totals, yet their stated supplement shares imply menopause-supplement markets $8.52 billion apart. The $600 billion figure is a 2020 opportunity claim, not annual revenue, and its public inputs multiply to $2 trillion.” — The HRT Index, Menopause Market Size Public Estimate Audit, August 3, 2026
Headline values
| Metric | Value |
|---|---|
| 2026 four-report benchmark median | $19.83B |
| 2026 benchmark range | $19.26B–$20.93B |
| 2030 normalized benchmark median | $25.07B |
| PwC current cross-sector estimate | ~$10B–$15B |
| Largest supplement-definition divergence | ~19× |
| Astellas-reported VEOZAH sales, FY2025 | ¥46.6B |
| Last fully verified | August 3, 2026 |
Source: Source:* The HRT Index analysis of public estimates from Grand View Research, Straits Research, The Business Research Company and Roots Analysis, plus PwC and Astellas. All source pages retrieved August 3, 2026. Method below.
The HRT Index Public-Estimate Benchmark is an unweighted synthesis of selected public market estimates. It is not an audited census of global revenue, and it is not a confidence interval. We think that qualifier makes it more useful, not less—it tells you exactly what you are quoting.
Here is the part that surprised us most. Grand View Research and Straits Research publish 2025 totals only $0.39 billion apart, a difference of about 2.1%. Grand View says dietary supplements are 94.3% of its market. Straits says 49.76%. Apply those shares to their own totals and the implied supplement values are $17.63 billion and $9.11 billion—an $8.52 billion gap hiding under two top-line figures that look almost identical.
A note on who we are and what we sell
We think you should have this before the data, not buried at the bottom.
This page argues that commercial publishers put out market numbers with incomplete public methods. The HRT Index is a commercial site too. As our affiliate disclosure explains, we earn referral commissions from hormone therapy providers on other pages of this domain. That gives readers every reason to scrutinize our work.
So: this page contains no advertising, provider recommendations, lead forms or commercial calls to action. The source pages, retrieval date, formulas, source ledger and CSV are public. You can reproduce the benchmark without trusting us.
What is the menopause market size in 2026?
Four selected public market-report estimates, normalized to a common year, produce a 2026 range of $19.26 billion to $20.93 billion and an unweighted median of $19.83 billion. PwC separately estimated a roughly $10 billion to $15 billion current market in May 2026 using a broader cross-sector model that includes pharmaceuticals, care delivery, devices and diagnostics, consumer health, and payer and employer solutions. The answers differ because they count different things, so neither should be quoted without its scope.
The HRT Index 2026 public-estimate benchmark
| Source | 2025 | 2026 | 2030 | Stated CAGR | Basis |
|---|---|---|---|---|---|
| Grand View Research | $18.70B | $19.70B | $24.50B derived | 5.6% | Published 2025 and 2026 values; 2030 calculated from 2026 |
| Straits Research | $18.31B | $19.26B | $23.72B derived | 5.34% | Published 2025 and 2026 values; 2030 calculated from 2026 |
| The Business Research Company | $18.78B | $19.95B | $26.21B published | 7.1% | All three values published |
| Roots Analysis | $19.90B | $20.93B derived | $25.64B derived | 5.2% | Published 2025 value; later years calculated |
| Unweighted median | $18.74B | $19.83B | $25.07B | — | The HRT Index calculation |
| Range | $18.31B–$19.90B | $19.26B–$20.93B | $23.72B–$26.21B | — | The HRT Index calculation |
Source: Source:* The HRT Index normalization of the four linked original-producer pages. Values marked “derived” were calculated from each publisher's own published value and stated CAGR. Retrieved August 3, 2026.
The formula, so you can check us
For any year after a source's published base value:
Normalized value = Published value × (1 + stated CAGR) ^ (target year − published year)
Worked example:
Grand View Research 2030 = $19.70B × (1 + 0.056)^4 = $24.4975B → $24.50B
Three conventions matter.
- Where a publisher gives an exact value for a year, we use the published value rather than a calculated one.
- We round each source value half up to two decimals before taking the median, so every displayed median can be reproduced by hand from the table.
- We do not interpolate backward before a source's published base year.
For 2026, the middle two displayed values are $19.70 billion and $19.95 billion. Their midpoint is $19.825 billion, displayed as $19.83 billion.

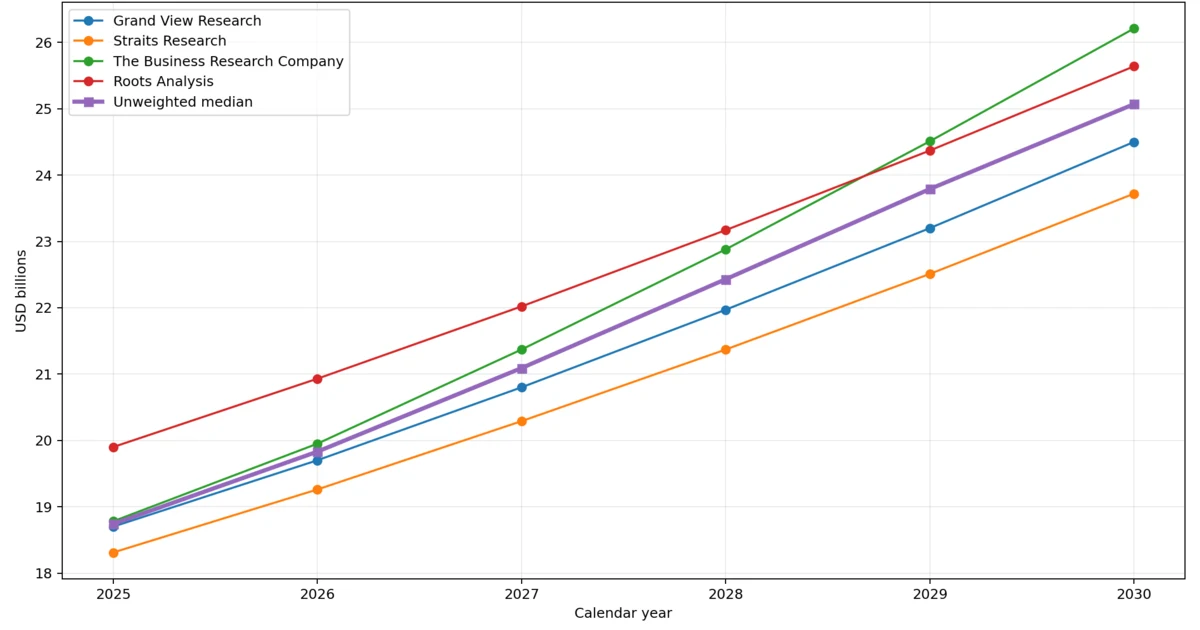
Figure source: The HRT Index normalization of Grand View Research, Straits Research, The Business Research Company and Roots Analysis. This is an original visualization of the public-source benchmark, not an observed revenue series.
Which menopause market size figure should you quote?
| If you are writing about… | Quote this | Attribute it as |
|---|---|---|
| The broad product category represented by the four-report benchmark | $19.83B in 2026; range $19.26B–$20.93B | The HRT Index median of four normalized public estimates, August 2026 |
| A cross-sector category including care delivery, devices, diagnostics, payers and employers | ~$10B–$15B currently; ~$15B–$25B by 2030 | PwC's estimate, May 2026 |
| Menopause prescription drugs specifically | $14.53B in 2026 | Fortune Business Insights' global menopause-drugs estimate |
| Menopause-specific supplements | $0.98B in 2025 | Future Market Insights' menopause-supplement estimate |
| Company-reported sales for a branded neurokinin product | ¥46.6B globally in FY2025 | Astellas-reported VEOZAH sales |
| The annual U.S. economic burden associated with menopause symptoms | $26.6B, including $1.8B in lost work time | Mayo Clinic study, 2023—a burden estimate, not revenue |
| A theoretical addressable opportunity | $600B | Female Founders Fund's 2020 opportunity claim, not annual revenue |
Source: Source: The HRT Index classification of the linked source types, retrieved August 3, 2026. Do not add these figures together. The categories overlap and measure different things.
What does this benchmark show, and what does it not show?
It shows where four selected public estimates cluster once they are converted to the same year using each publisher's own stated growth rate. It does not prove that global menopause-related revenue was $19.83 billion in 2026. No publicly available audited census of that revenue appeared in the material we reviewed.
What the audit supports:
- Four separately published global estimates land within $1.67 billion of one another for 2026.
- Their stated growth rates span 5.2% to 7.1%, a 1.9-percentage-point gap.
- The top-line numerical cluster hides a much larger disagreement about what the market contains.
- Some figures used in menopause business coverage are economic-burden estimates or addressable-opportunity claims, not annual sales.
What it does not support:
- A claim that $19.83 billion is the observed true size of the category.
- A claim about the profitability or valuation of menopause companies.
- A claim about what an individual woman spends.
- A claim about treatment safety, efficacy or appropriateness. That is not what this page measures.
How we built this menopause market size benchmark
We reviewed publicly accessible pages from original estimate producers on August 3, 2026, applied a written inclusion rule, normalized the qualifying estimates to common calendar years using each publisher's own stated CAGR, and reported the unweighted median and range. We did not buy the underlying reports, merge private datasets or independently measure company revenue.
What had to be true for a source to enter the four-report cluster
- The page is published by the original producer of the estimate, not a syndicator or a third-party press release.
- It describes a global market that it labels as the menopause market.
- It publishes a 2025 or 2026 value plus a forecast value or CAGR.
- It gives enough visible scope information to classify what is being counted.
- Its public methodology does not disclaim market sizing or forecasting on the same product page.
- Its principal market-size series contains no unresolved numeric contradiction.
- It is not a duplicate of another included estimate.
What we deliberately excluded, and why
| Excluded source or category | Reason |
|---|---|
| PwC's $10B–$15B range | A range from a materially different cross-sector model. It is shown prominently and separately—too authoritative to bury and too different to average in. |
| Drugs-only, supplements-only and treatment-only estimates | Narrower baskets. They remain in the full ledger for comparison. |
| U.S.-only and other regional estimates | The benchmark is global. |
| Economic-burden estimates | Costs, not revenue. |
| Addressable-opportunity claims | Theoretical spending pools, not observed sales. |
| MarketDataForecast, SkyQuest, Strategic Market Research and DelveInsight | Each has an unresolved value, snapshot, year-pair or arithmetic conflict on its current public page. |
| 360iResearch | Its visible summary does not define the market basket, and its methodology text says it emphasizes evidence and trends rather than market sizing or forecasting. |
| Future Market Insights treatment | A narrower treatment basket, and the current page contains an unrelated industrial food slicers section. |
Source: Source:* The HRT Index source-selection protocol and current public-page audit, August 3, 2026. The full evidence ledger appears below and in the downloadable CSV.
This is a source-selection protocol. It is not a claim that the four included publishers measure identical baskets. They demonstrably do not.
Selection sensitivity: what happens if 360iResearch is included?
Because that exclusion affects the low end, we tested it directly. Add 360iResearch's published $15.88 billion 2026 value to the four-report set and the five-source median becomes $19.70 billion, while the range expands to $15.88 billion–$20.93 billion. The primary benchmark remains four reports because 360iResearch's visible public summary does not define the measured basket and its methodology text expressly shifts emphasis away from market sizing and forecasting. We publish the sensitivity result so the selection effect is visible rather than hidden.
Source: The HRT Index sensitivity calculation from the four benchmark sources and 360iResearch, retrieved August 3, 2026.
What we did not do
We did not weight publishers by reputation, report price or claimed rigor. We did not adjust for inflation because the public pages generally do not state whether their figures are nominal or real; do not describe these as inflation-adjusted dollars. We did not purchase any report. We evaluated only what a reader can verify without paying.
The public pages do not expose the row-level inputs needed to reconstruct their menopause totals from the bottom up. That is why this benchmark is built from published outputs, visible scopes and reproducible arithmetic rather than from audited source data.
Public menopause market estimate ledger
This is the full 15-source public ledger reviewed for version 1.0. “Included” means included in the four-report median, not endorsed as true.
| Original producer | Public series | Stated CAGR | Visible public basket | Benchmark treatment |
|---|---|---|---|---|
| Grand View Research | $18.70B (2025); $19.70B (2026); $28.80B (2033) | 5.6% | Dietary supplements and OTC pharmaceutical products | Included |
| Straits Research | $18.31B (2025); $19.26B (2026); $29.19B (2034) | 5.34% | Supplements, hormone therapies and nonhormonal therapies | Included |
| The Business Research Company | $18.78B (2025); $19.95B (2026); $26.21B (2030) | 7.1% for 2026–2030 | Headline scope emphasizes supplements and OTC; definition also lists HRT, SSRIs and SNRIs | Included; scope ambiguity recorded |
| Roots Analysis | $18.69B (2024); $19.90B (2025); $33.17B (2035) | 5.2% | Supplements and OTC hormonal and nonhormonal products | Included |
| PwC | ~$10B–$15B currently; ~$15B–$25B (2030) | 8%–10% | Cross-sector category | Separate; not averaged |
| Fortune Business Insights | $13.39B (2025); $14.53B (2026); $28.19B (2034) | 8.63% | Menopause drugs | Separate narrower basket; U.S. unit conflict recorded |
| Coherent Market Insights | $16.19B (2026); $24.83B (2033) | 6.3% | Hormone and nonhormonal treatment | Separate narrower basket |
| Future Market Insights—supplements | $0.98B (2025); both $1.00B and $1.04B (2026); $1.81B (2036) | 5.7% | Menopause-formulated supplements; excludes prescription HRT and general multivitamins | Separate narrower basket; value conflict recorded |
| Future Market Insights—treatment | $0.799B (2025); $1.380B (2035) | 5.6% | Hormone and nonhormonal treatment | Separate narrower basket; unrelated-page section recorded |
| Market Research Future | $17.20B (2024); $18.08B (2025); $29.79B (2035) | 5.12% | Menopause treatment | Separate narrower basket |
| MarketDataForecast | Both $20.97B and $19.66B (2024); $35.07B (2033) | 6.64% | Menopause market | Excluded; base-year conflict |
| SkyQuest | $19.72B (2024); $20.90B (2025); $33.32B (2033); separate $18.60B snapshot | 6.0% | Supplements and OTC hormonal and nonhormonal products | Excluded; snapshot conflict |
| Strategic Market Research | $20.50B (2024); $34.50B (2030) | 8.5% | HRT, nonhormonal treatments, herbal supplements and other products | Excluded; CAGR conflict |
| DelveInsight | $15.53B and $23.44B assigned to both 2023–2030 and 2022–2028 | 7.1% | Menopause market | Excluded; year-pair conflict |
| 360iResearch | $14.80B (2025); $15.88B (2026); $24.69B (2032) | 7.58% | Visible summary does not define the basket; narrative spans care, digital health, workplace and consumer wellness | Excluded; basket not classifiable and method-scope conflict |
Source: Source:* The linked original-producer pages, retrieved August 3, 2026. The CSV preserves the displayed series, visible scope, inclusion decision, issue status and retrieval date for every row.
Why do menopause market size estimates disagree?
They disagree mainly because publishers count different products and services. Some models are dominated by dietary supplements. Others include prescription hormone therapy, nonhormonal drugs, clinician services, diagnostics, devices or employer solutions. A menopause market figure without its definition attached is incomplete, and the definitional gap is larger than the numerical gap.
At least seven different quantities get called “the menopause market”
| Quantity | What it counts | Verified example |
|---|---|---|
| Supplements and OTC products | Supplements, cooling or symptom products, and OTC pharmaceuticals | Grand View Research, $19.70B in 2026 |
| Prescription drugs | Hormone therapies and nonhormonal prescription drugs | Fortune Business Insights, $14.53B in 2026 |
| Combined product market | Supplements plus hormonal and nonhormonal treatment categories | Straits Research, $19.26B in 2026 |
| Cross-sector category | Products, care delivery, devices, diagnostics, consumer health, payers and employers | PwC, ~$10B–$15B currently |
| Company-reported product sales | Actual sales of a named product | Astellas VEOZAH, ¥46.6B in FY2025 |
| Economic burden | Medical costs, missed work and productivity effects | Mayo Clinic study, $26.6B annually in the U.S. |
| Addressable opportunity | A theoretical spending pool | Female Founders Fund, $600B in 2020 |
Source: Source:* The HRT Index classification of the linked original sources, retrieved August 3, 2026.
Before you quote a menopause market figure, ask whether prescription drugs are inside it or outside it. That one question separates most of the range.
The menopause supplement definition gap is roughly 9× to 19×
This is the clearest evidence that the category is not consistently defined. Apply each publisher's own stated supplement share to its own 2025 total, then compare the result with Future Market Insights' directly published 2025 menopause-supplement value.
| Publisher | Calculation | Implied or published 2025 menopause-supplement market | Multiple of $0.98B |
|---|---|---|---|
| Roots Analysis | $19.90B × approximately 95% | approximately $18.91B | approximately 19.3× |
| Grand View Research | $18.70B × 94.3% | $17.63B | 18.0× |
| Straits Research | $18.31B × 49.76% | $9.11B | 9.3× |
| Future Market Insights | Directly published | $0.98B | 1.0× |
Source: Source:* The HRT Index calculation from published totals and segment shares. Roots says “nearly 95%,” so its line is explicitly approximate. Future Market Insights' value is directly published. Retrieved August 3, 2026.
Future Market Insights defines its basket as supplements formulated for menopause and explicitly excludes prescription hormone therapy, prescription bioidentical hormones and general women's multivitamins not specifically formulated for menopause. Grand View Research and Roots Analysis use broader public supplement buckets than FMI's explicit exclusions. Straits Research sits between them, with supplements, hormone therapies and nonhormonal therapies inside the same market.
None of this proves that one publisher has found the true number. It proves that “menopause supplements” is not one consistently measured thing.
Some current public pages contradict themselves or break scope
We flag these because the contradiction exists on the live public page a reader is expected to use. We are not alleging bad faith. We are recording what is reproducible and what is not.
| Page | Current public-page issue | Audit result |
|---|---|---|
| MarketDataForecast | The same paragraph reports both $20.97B and $19.66B for 2024. | Only $19.66B reproduces the stated 6.64% CAGR to $35.07B in 2033. |
| SkyQuest | Narrative values of $19.72B in 2024 and $20.90B in 2025 sit beside a separate $18.60B page snapshot. | The narrative endpoint series passes its CAGR test; the snapshot remains unreconciled. |
| Strategic Market Research | $20.50B in 2024 to $34.50B in 2030 is labeled 8.5%. | The endpoints imply 9.063%. |
| Future Market Insights—supplements | Both $1.00B and $1.04B appear for 2026. | Only $1.04B reproduces 5.7% to $1.81B in 2036. |
| DelveInsight | The same $15.53B and $23.44B values are assigned to 2023–2030 and 2022–2028. | The six-year interval reproduces 7.1%; the seven-year interval does not. |
| 360iResearch | Its method text says emphasis is placed on evidence and trends rather than market sizing or forecasting. | That statement conflicts with a page whose purpose is a market-size forecast. |
| Future Market Insights—treatment | The menopause-treatment page contains a full section about industrial food slicers. | The unrelated section is a live scope break; the displayed treatment endpoints themselves pass the CAGR test. |
| Fortune Business Insights | The page states a $5.27 million U.S. 2025 value while also saying the U.S. is 39.3% of a $13.39B global market and North America is $5.73B. | 39.3% × $13.39B = approximately $5.26B. The displayed U.S. unit is inconsistent by roughly three orders of magnitude. |
Source: Source:* The HRT Index review and arithmetic audit of the linked live pages, August 3, 2026.
These are web pages, not immutable filings. A retrieval date is part of the evidence. Version 1.0 records the live state reviewed on August 3, 2026; later changes belong in a new dataset version rather than being silently overwritten.
What do companies actually report?
Every market figure above is a model. Company reporting gives us something different: actual product sales. It still does not produce a complete bottom-up menopause market, but it gives the top-down forecasts a reality check.
VEOZAH (fezolinetant), Astellas
The FDA approved VEOZAH on May 12, 2023 for moderate to severe vasomotor symptoms caused by menopause. It was the first FDA-approved neurokinin 3 receptor antagonist for that indication. It was not the first FDA-approved nonhormonal prescription treatment for menopausal vasomotor symptoms; Brisdelle had already been approved.
| Disclosure | Figure | Source and date |
|---|---|---|
| First nine months of FY2025, April–December 2025 | ¥35.2B | Astellas Q3 FY2025 supplementary results, February 4, 2026 |
| Nine-month year-over-year change | +¥10.8B; +44.0% | Same |
| U.S. sales for the first nine months | $209M | Same |
| Full FY2025 global sales, April 2025–March 2026 | ¥46.6B | Astellas FY2025 supplementary results, April 27, 2026 |
| Full FY2025 year-over-year change | +37.7% | Same |
| Full FY2025 U.S. sales | $269M | Same |
| Approximate full-year global USD value | approximately $309M | The HRT Index conversion: ¥46.6B ÷ ¥151 per U.S. dollar |
Source: Source:* Astellas Q3 FY2025 supplementary results and Astellas FY2025 supplementary results. The exchange rate is Astellas' reported FY2025 average. Retrieved August 3, 2026.
Astellas changed forecasts, not actual-sales reporting
At its April 27, 2026 full-year results, Astellas said that beginning in FY2026 it had discontinued individual product sales forecasts. It did not say that individual actual sales would disappear. The same presentation says actual results will continue to be explained product by product, and the FY2025 supplementary document reports VEOZAH's full-year sales directly.
That distinction matters. Forward product guidance became less granular. Historical product sales remained available in the reporting reviewed for this page.
Lynkuet (elinzanetant), Bayer
The FDA approved Lynkuet on October 24, 2025 for moderate to severe vasomotor symptoms due to menopause. Bayer describes it as the first dual neurokinin-1 and neurokinin-3 receptor antagonist for the indication. Bayer's 2025 annual report records the rollout sequence—first worldwide approval in the United Kingdom in July 2025, followed by Australia, Canada and Switzerland, then the U.S. in October and the European Union in November—but does not report a separate Lynkuet sales line for 2025.
We are saying that rather than estimating one.
What this company check establishes
VEOZAH provides one clean full-year product-sales line: ¥46.6 billion globally in FY2025. Lynkuet provides a documented launch and approval timeline but no separate 2025 sales line in Bayer's annual report. Generic hormone therapies, supplements, OTC products, clinician services and employer programs are spread across many companies and reporting categories.
That is why the top-down $10 billion, $15 billion and $20 billion estimates cannot currently be reconciled from public company reporting alone. It does not prove those estimates wrong. It shows how little of the category can be verified product by product.
What will the menopause market be worth in 2030?
The four-report normalized benchmark reaches a median of $25.07 billion in 2030, within a $23.72 billion to $26.21 billion range. PwC separately projects its differently defined cross-sector category at roughly $15 billion to $25 billion by 2030. These are modeled forecasts, not revenue that has occurred.
Normalized annual benchmark, 2025–2030
| Year | Median | Lowest | Highest | Range width |
|---|---|---|---|---|
| 2025 | $18.74B | $18.31B | $19.90B | $1.59B |
| 2026 | $19.83B | $19.26B | $20.93B | $1.67B |
| 2027 | $21.09B | $20.29B | $22.02B | $1.73B |
| 2028 | $22.43B | $21.37B | $23.17B | $1.80B |
| 2029 | $23.79B | $22.51B | $24.51B | $2.00B |
| 2030 | $25.07B | $23.72B | $26.21B | $2.49B |
Source: Source:* The HRT Index normalization of four public estimate series using each publisher's stated CAGR and the round-half-up convention described above. This is a calculated inference, not a confidence interval, weighted meta-analysis or observed revenue. Retrieved August 3, 2026.
The range widens from $1.59 billion in 2025 to $2.49 billion in 2030. That is not a formal measurement of uncertainty. It is what happens when four different growth rates are projected forward from different starting points. The farther out the year, the more the result reflects each publisher's assumptions.
Menopause market growth rate data
The four benchmark reports state forecast CAGRs from 5.2% to 7.1%. PwC uses 8% to 10% for its broader cross-sector category. Coherent Market Insights states 6.3% for a treatment market, and Fortune Business Insights states 8.63% for menopause drugs.
There is no single menopause market CAGR. A growth rate without the source, date range and basket is incomplete.
Is the menopause market really worth $600 billion?
No—not as annual revenue.
The $600 billion figure originated as an addressable-opportunity claim in a 2020 Female Founders Fund report. Fortune's October 26, 2020 coverage described the public basis as roughly one billion women expected to be in menopause worldwide by 2025, with average annual spending of about $2,000 across prescriptions, doctor visits, treatments, devices and products. Fortune also reported that Female Founders Fund surveyed 250 women.
The arithmetic
1,000,000,000 women × $2,000 per year = $2,000,000,000,000
That is $2 trillion. The published headline is $600 billion.
For those two public inputs to produce $600 billion, one of these would need to be true:
- Annual spending would be $600 per woman, not $2,000; or
- The spending population would be 300 million women, not one billion.
A model could reasonably apply an access, income, treatment-seeking or active-spending adjustment. The surviving public explanation does not state one, so the headline cannot be reproduced from the inputs attached to it.
The population figure was also a projection for 2025. That year has passed. This does not invalidate an opportunity model by itself, but it fixes the claim in its proper context: a 2020 opportunity estimate built around a 2025 population projection, not current annual market revenue.
How to characterize the $600 billion figure accurately
A defensible sentence is:
A 2020 Female Founders Fund report characterized menopause as a $600 billion business opportunity. The figure is an addressable-opportunity estimate rather than annual market revenue, and its surviving public methodology does not reconcile the headline with the stated one-billion-women and $2,000-per-year inputs.
What it should not be used for: any sentence of the form “the menopause market has $600 billion in annual revenue.”
How is menopause market revenue different from the economic cost of menopause?
Market estimates model sales of products and services. Economic-burden studies estimate costs such as medical spending and lost work time, whether or not those costs become anyone's revenue.
A Mayo Clinic study published in 2023 estimated $26.6 billion in annual U.S. costs associated with menopause symptoms, including $1.8 billion in lost work time. That is a burden estimate, not a market size.
| Quantity | Example | What it measures | Annual market revenue? |
|---|---|---|---|
| Public-estimate benchmark | $19.83B in 2026 | Median of four modeled annual market series after common-year normalization | A modeled revenue benchmark, with scope and method attached |
| Cross-sector market estimate | ~$10B–$15B currently | PwC's multi-sector menopause category | A modeled market estimate, with PwC attribution |
| Company-reported product sales | ¥46.6B in FY2025 | Astellas-reported VEOZAH sales | Yes, for that named product and fiscal year |
| Economic burden | $26.6B annually in the U.S., including $1.8B lost work time | Estimated medical and workplace costs associated with symptoms | No |
| Addressable opportunity | $600B | A theoretical spending pool published in 2020 | No |
Source: Source:* The HRT Index classification. Burden data from the Mayo Clinic study and Mayo Clinic summary; market and company values from the linked original sources. Retrieved August 3, 2026.
The study context belongs next to the $26.6 billion number. Researchers invited 32,469 women aged 45 to 60 receiving Mayo Clinic primary care to participate. Just over 5,200 responded, a 16.1% response rate. The analysis included 4,440 employed respondents, and 93% were White. The national cost figure is an estimate derived from that cross-sectional survey—not an observed national accounting ledger.
Which published menopause estimates pass a basic arithmetic check?
We tested whether each page's displayed endpoints reproduce its displayed growth rate, allowing 0.10 percentage points for rounding.
Implied CAGR = (forecast value ÷ starting value) ^ (1 ÷ years) − 1
| Public series | Stated CAGR | Implied CAGR | Result |
|---|---|---|---|
| Grand View Research: $19.70B (2026) → $28.80B (2033) | 5.60% | 5.575% | Pass |
| Straits Research: $19.26B (2026) → $29.19B (2034) | 5.34% | 5.335% | Pass |
| The Business Research Company: $19.95B (2026) → $26.21B (2030) | 7.10% | 7.061% | Pass |
| Roots Analysis: $19.90B (2025) → $33.17B (2035) | 5.20% | 5.242% | Pass |
| Coherent Market Insights: $16.19B (2026) → $24.83B (2033) | 6.30% | 6.300% | Pass |
| Fortune Business Insights: $14.53B (2026) → $28.19B (2034) | 8.63% | 8.637% | Pass |
| 360iResearch: $15.88B (2026) → $24.69B (2032) | 7.58% | 7.633% | Pass |
| Market Research Future: $18.08B (2025) → $29.79B (2035) | 5.12% | 5.120% | Pass |
| SkyQuest narrative: $20.90B (2025) → $33.32B (2033) | 6.00% | 6.003% | Pass |
| Strategic Market Research: $20.50B (2024) → $34.50B (2030) | 8.50% | 9.063% | Flag |
| MarketDataForecast: $20.97B (2024) → $35.07B (2033) | 6.64% | 5.880% | Flag |
| MarketDataForecast: $19.66B (2024) → $35.07B (2033) | 6.64% | 6.642% | Pass—the consistent base value |
| FMI supplements: $1.00B (2026) → $1.81B (2036) | 5.70% | 6.113% | Flag |
| FMI supplements: $1.04B (2026) → $1.81B (2036) | 5.70% | 5.697% | Pass—the consistent 2026 value |
| FMI treatment: $0.799B (2025) → $1.380B (2035) | 5.60% | 5.617% | Pass |
Source: Source:* The HRT Index calculation from the linked original-producer pages. Tolerance: 0.10 percentage points. Retrieved August 3, 2026.
A pass means only that a page's displayed endpoints agree with its stated CAGR. It says nothing about whether the forecast is economically sound. SkyQuest's narrative series passes while its separate page snapshot still conflicts. 360iResearch's endpoints pass while its methodology statement still conflicts with the product. Arithmetic is one integrity check, not the whole audit.
What does the menopause market include?
There is no universal public definition. Depending on the publisher, the category may include dietary supplements, OTC products, prescription hormone therapy, nonhormonal drugs, care delivery, diagnostics, devices, digital health services, and employer or payer solutions.
| Component | Included in these visible public scopes | Commonly outside these scopes |
|---|---|---|
| Dietary supplements | Grand View Research, Roots Analysis, Straits Research, TBRC headline scope | Drug-only and treatment-only estimates |
| OTC products | Grand View Research, Roots Analysis, TBRC headline scope | Drug-only estimates |
| Prescription hormone therapy | Straits Research, Coherent Market Insights, Fortune Business Insights, FMI treatment, Strategic Market Research; also listed in TBRC's definition | Grand View's public supplement-and-OTC framing |
| Nonhormonal prescription drugs | Straits Research, PwC, Coherent Market Insights, Fortune Business Insights, FMI treatment | Supplements-only estimates |
| Care delivery and clinician services | PwC | Most product-market estimates |
| Devices and diagnostics | PwC | Most product-market estimates |
| Consumer digital health | PwC | Most product-market estimates |
| Employer and payer solutions | PwC | Most product-market estimates |
Source: Source:* The HRT Index classification based on each linked publisher's visible public scope description, retrieved August 3, 2026.
This table explains why scope cannot be inferred from the size of the number. PwC counts more sectors and still arrives at a lower current estimate than the four-report cluster. A broader-sounding basket does not automatically produce a larger figure. Scope, data inputs and model construction all matter.
Why this matters now
Three verified facts make the definition problem harder to ignore in 2026.
First, the prescription landscape changed. VEOZAH was approved in 2023 as the first NK3 receptor antagonist for menopausal vasomotor symptoms, and Lynkuet followed in October 2025 as a dual NK1/NK3 therapy. A market framed publicly around supplements and OTC products does not capture that prescription category in the same way as a drugs or cross-sector model.
Second, a company-reported full-year product line now exists. Astellas reported ¥46.6 billion in FY2025 VEOZAH sales. That does not validate a $20 billion top-down market, but it gives readers a hard number to compare with modeled categories.
Third, revenue, burden and opportunity figures circulate beside one another even though they answer different questions. $19.83 billion, $26.6 billion and $600 billion are not competing estimates of the same thing. One is a normalized public-estimate benchmark, one is an annual U.S. burden estimate, and one is a 2020 opportunity claim.
None of this makes one publisher automatically right. It raises the cost of quoting a number without its definition.
Limitations
We would rather state these plainly than have a reader discover them.
| Limitation | Why it matters |
|---|---|
| No common audited census appeared in the public material reviewed | Every global headline value here is an estimate, not observed category-wide revenue |
| Source baskets differ substantially | Similar totals can represent incompatible product mixes |
| Equal weighting is not quality weighting | The median does not assert that all four publishers are equally reliable |
| Paid reports may contain detail the public pages do not | We evaluated only what a reader can verify without buying a report |
| Forecasts are modeled | The 2030 values are projections, not revenue that has occurred |
| Inflation treatment is generally unstated | Do not describe the values as real or inflation-adjusted dollars |
| Categories overlap | Adding drugs, supplements, services, burden and opportunity values will double-count or mix quantities |
| Public pages are mutable | Every record carries a retrieval date and dataset version |
| Arithmetic consistency is weak evidence | A forecast can reproduce its CAGR and still be wrong about the world |
| Product-level company reporting is sparse | VEOZAH has a full-year line; Lynkuet did not have a separate 2025 sales line in Bayer's annual report |
| The Mayo burden estimate comes from a survey sample | The response rate was 16.1%, and 93% of analyzed employed respondents were White |
| This is not clinical research | Nothing here assesses treatment safety, efficacy or appropriateness |
Source: Source:* The HRT Index methodology and source audit, version 1.0, August 3, 2026.
For authoritative clinical information, use current FDA-approved labeling and peer-reviewed evidence. This page measures market claims, not treatment decisions.
Frequently asked questions
What is the menopause market size in 2026?
Four selected public estimates normalized to a common year produce an unweighted median of $19.83 billion for 2026, within a range of $19.26 billion to $20.93 billion. PwC separately estimates a broader cross-sector category at roughly $10 billion to $15 billion. No publicly audited global total was available in the material reviewed.
What will the menopause market be worth in 2030?
The four-report benchmark produces a normalized 2030 median of $25.07 billion, within a range of $23.72 billion to $26.21 billion. PwC projects its separately defined cross-sector category at roughly $15 billion to $25 billion by 2030. Both are modeled forecasts.
What is the menopause market CAGR?
There is no single menopause market CAGR. The four benchmark reports state rates from 5.2% to 7.1%. PwC estimates 8% to 10% annual growth for its broader category. Fortune Business Insights states 8.63% for menopause drugs specifically. The source and basket belong next to the rate.
Is menopause a $600 billion market?
Not as annual revenue. The $600 billion figure is a 2020 Female Founders Fund addressable-opportunity claim. Its publicly described inputs—about one billion women and roughly $2,000 in annual spending—multiply to $2 trillion, so the surviving public explanation does not reproduce the headline.
Does menopause market size include HRT?
It depends on the source. Straits Research explicitly includes hormone therapies. Grand View Research publicly frames its market around dietary supplements and OTC pharmaceutical products. The Business Research Company’s headline scope emphasizes supplements and OTC products, while its definition also lists HRT, SSRIs and SNRIs. PwC includes pharmaceuticals inside a broader cross-sector category.
How large is the menopause supplement market?
The answer changes by about nineteenfold depending on definition. Future Market Insights publishes $0.98 billion for 2025 for supplements formulated for menopause, excluding prescription HRT and general multivitamins. Applying Grand View Research’s stated 94.3% supplement share to its $18.70 billion total implies $17.63 billion. Those figures are not comparable without their inclusion rules.
Is the cost of menopause the same as the menopause market size?
No. A 2023 Mayo Clinic study estimated $26.6 billion in annual U.S. costs associated with menopause symptoms, including $1.8 billion in lost work time. That is an economic-burden estimate derived from a survey study, not revenue earned by menopause companies.
How much menopause revenue can be checked against company reporting?
Astellas reported ¥46.6 billion in global VEOZAH sales for FY2025, including $269 million in U.S. sales. Bayer’s 2025 annual report records the launch and approvals of Lynkuet but does not provide a separate Lynkuet sales line. Product-level reporting therefore supplies a useful check, but not a bottom-up census of the category.
Which menopause market number should a journalist quote?
Match the number to the sentence. For a transparent cross-report benchmark, use “$19.83 billion in 2026, the unweighted median of four normalized public estimates,” with the $19.26 billion to $20.93 billion range. For a cross-sector view, use PwC’s $10 billion to $15 billion with PwC attribution. For drugs, supplements, economic burden or company sales, use the figure built for that specific question and do not add overlapping categories together.
Why do menopause market estimates disagree?
They use different baskets, years and data models. Grand View Research and Straits Research publish 2025 totals only $0.39 billion apart, yet their stated supplement shares imply supplement values $8.52 billion apart. The numerical agreement at the top line can hide a much larger definitional disagreement underneath it.
Download the dataset
Download the Menopause Market Size Public Estimate Audit, 2026, version 1.0 CSV.
The CSV contains the 15-source public ledger, source-year normalizations, annual benchmark summaries, the 360iResearch selection-sensitivity result, endpoint CAGR checks, supplement-definition calculations, company and regulatory records, and the burden-versus-opportunity classifications used on this page. All records carry a retrieval date and source URL.
How to cite this page
Page: The HRT Index Editorial Team. “Menopause Market Size: What Current Data Shows in 2026.” The HRT Index. Last verified August 3, 2026. https://thehrtindex.com/research/menopause-market-size/
Dataset: The HRT Index Editorial Team. Menopause Market Size Public Estimate Audit, 2026. Version 1.0. August 3, 2026. https://thehrtindex.com/research/data/menopause-market-size-public-estimates-2026.csv
Primary and original sources
Market-estimate producers
- PwC, “Unlocking the menopause opportunity,” May 11, 2026
- Grand View Research, menopause market report
- Straits Research, menopause market report
- The Business Research Company, menopause global market report
- Roots Analysis, menopause market report
- Fortune Business Insights, menopause drugs market
- Coherent Market Insights, global menopause treatment market
- Future Market Insights, menopause supplement market
- Future Market Insights, menopause treatment market
- Market Research Future, menopause treatment market
- MarketDataForecast, menopause market
- SkyQuest, menopause market
- Strategic Market Research, menopause market
- DelveInsight, menopause market
- 360iResearch, menopause market
Company and regulatory records
- Astellas Pharma, Q3 FY2025 supplementary results, February 4, 2026
- Astellas Pharma, FY2025 supplementary results, April 27, 2026
- Astellas Pharma, FY2025 results script, April 27, 2026
- FDA, VEOZAH approval announcement, May 12, 2023
- FDA, VEOZAH summary review showing the pre-existing Brisdelle option, 2023
- FDA, Brisdelle summary review, 2013
- FDA, Lynkuet approval package, October 24, 2025
- Bayer, Lynkuet U.S. approval announcement, October 24, 2025
- Bayer Annual Report 2025
Opportunity claim and economic burden
- Female Founders Fund, menopause opportunity report landing page, 2020
- Fortune, original coverage of the Female Founders Fund report, October 26, 2020
- Mayo Clinic Proceedings study, PubMed ID 37115119
- Mayo Clinic summary of the workplace-cost study, April 26, 2023
All web pages and documents were retrieved or rechecked on August 3, 2026.
Revision history
| Version | Date | Change |
|---|---|---|
| 1.0 | August 3, 2026 | Initial publication. Four-report benchmark established; 15 public estimate producers catalogued; common-year normalization, arithmetic audit, supplement-definition comparison, company-reporting check and source-integrity ledger published. |
Source: Source:* The HRT Index dataset-version record.
When a source publisher changes a value, we record the old value, the new value, the verification date and the source, then issue a new dataset version rather than overwriting the record under our corrections policy.