Average Age of Menopause by Country: 27 Sourced Estimates
By The HRT Index Editorial Team · Editorial research, not medically reviewed · Updated September 2026
Average age of menopause by country: 24 of the 27 selected study estimates below fall between 48 and 52. The HRT Index's September 2026 source check found that Taiwan's listed 44.6 matches a Pakistani hospital study; a Taiwanese national-survey analysis estimates a median of 50. Find your country below.
Key menopause-age findings
- Taiwan, 44.6 vs 50. World Population Review lists Taiwan at 44.6 without a source attached to that row. One of its listed sources reports the same mean for 362 women with natural or surgical menopause at a hospital in Karachi, Pakistan. A Taiwanese national-survey analysis of 4,111 women estimates a natural-menopause median of 50. The HRT Index's source check found a 5.4-year gap, not a change over time. (Listing; Rana 2021; Shen 2019; checked Sept. 29, 2026.)
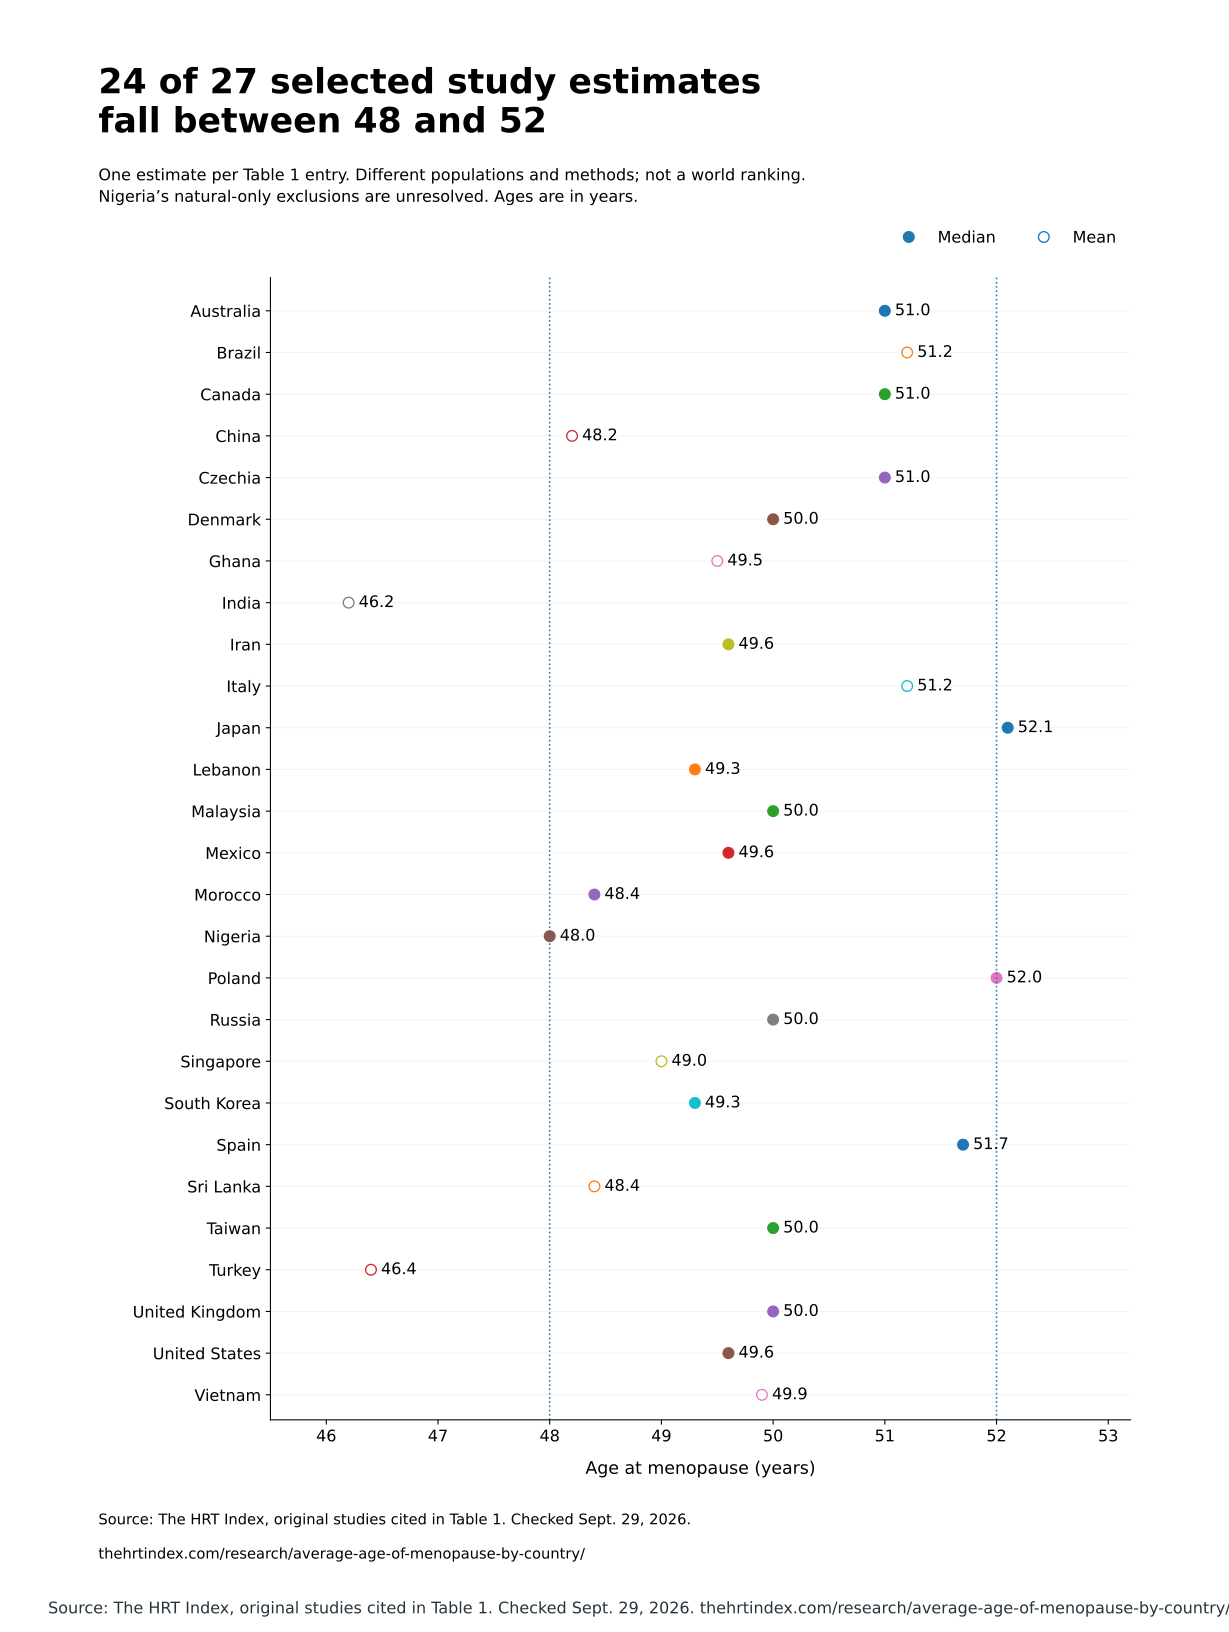
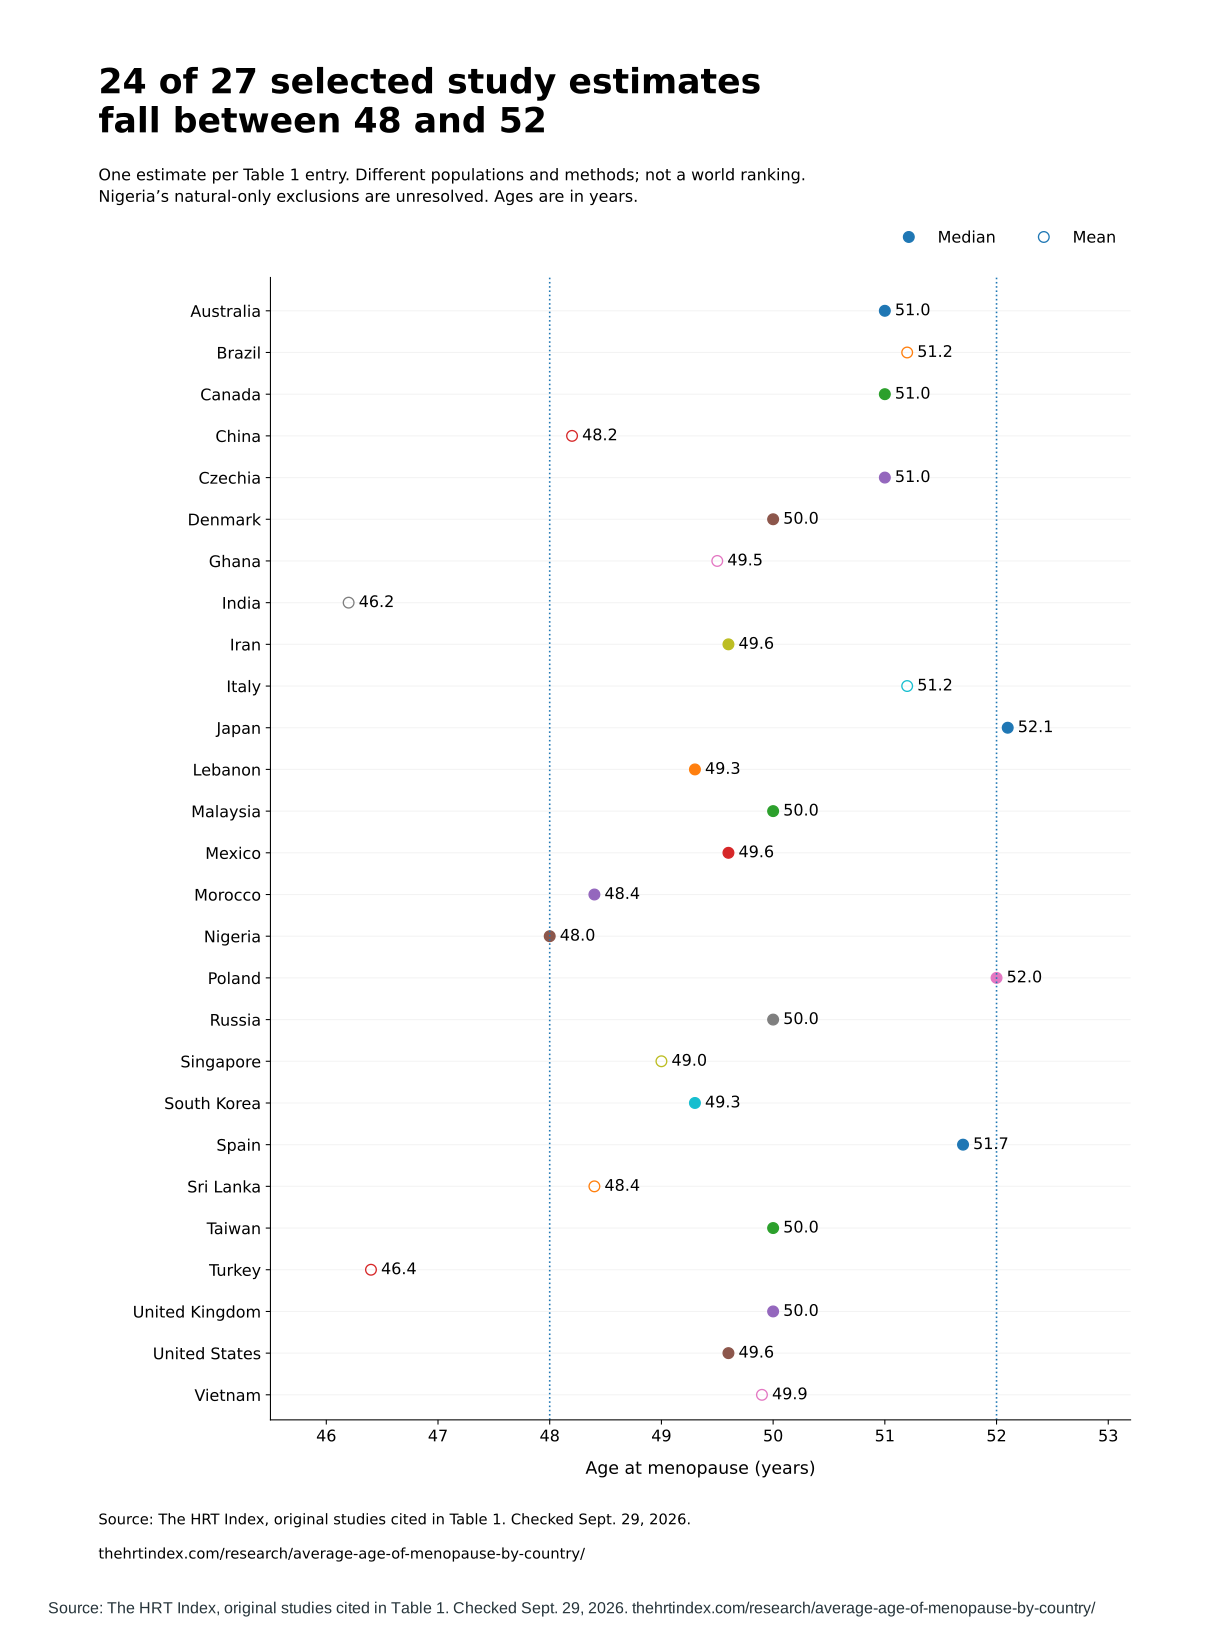
- 24 of 27 selected estimates between 48 and 52. In The HRT Index's September 2026 Table 1, 24 of 27 headline study estimates fall in that band; their middle value is 49.9. The lowest is India (46.2, mean) and the highest is Japan (52.1, median). These are selected study results, not national rankings. (Data and calculation C02–C04.)
- 121 of 130 round numbers. In World Population Review's 2026 edition, 121 of 130 country and territory values are whole numbers. Its 12 listed sources are not attached to individual rows. The HRT Index counted the entries on Sept. 29, 2026. (Listing; row-level snapshot.)
- 48.8 in a global study review. A 2014 meta-analysis of 36 community-based studies put the pooled mean age at natural menopause at 48.8 (95% confidence interval, or CI, 48.3 to 49.2). Study means ranged from 46 to 52. This combines study estimates, not every country's population. (Schoenaker et al., International Journal of Epidemiology, 2014.)
- India, 46.2. In a pan-India survey, 1,415 women with natural menopause had a mean age of 46.2. The combined group, including 292 study-labelled surgical menopauses, had a mean of 45.59, or 45.6 rounded. (Ahuja, Journal of Mid-life Health, 2016.)
- Japan, 52.1. The estimated median age at natural menopause was 52.1 in an analysis of 24,152 nurses aged 40 and older, including women who had not yet reached menopause. (Yasui et al., Maturitas, 2012.)
- China, 48.2. Among 141,789 naturally postmenopausal women in 10 selected regions, the mean age at natural menopause was 48.2. The data were collected in 2004–2008, not 2022. (China Kadoorie Biobank; Wang et al., Nutrition & Metabolism, 2022.)
- United States, 49.9 mean and 49.6 median. In national survey data from 2015 to 2018, 973 eligible women aged 40 to 74 had a mean age at natural menopause of 49.9 and a median of 49.6. The analysis excluded menopause before 40 or after 62, treatment-induced menopause and other racial/ethnic groups than Black, White or Hispanic. (Appiah et al., JAMA, 2021.)
- Latin American cities, 43.8 to 53. Across a survey of 17,150 women aged 40–59 in 47 cities in 15 countries, the estimated median age at menopause was 48.6. City estimates ran from 43.8 in Asunción, Paraguay to 53 in Cartagena, Colombia. (Castelo-Branco et al., Menopause, 2006.)
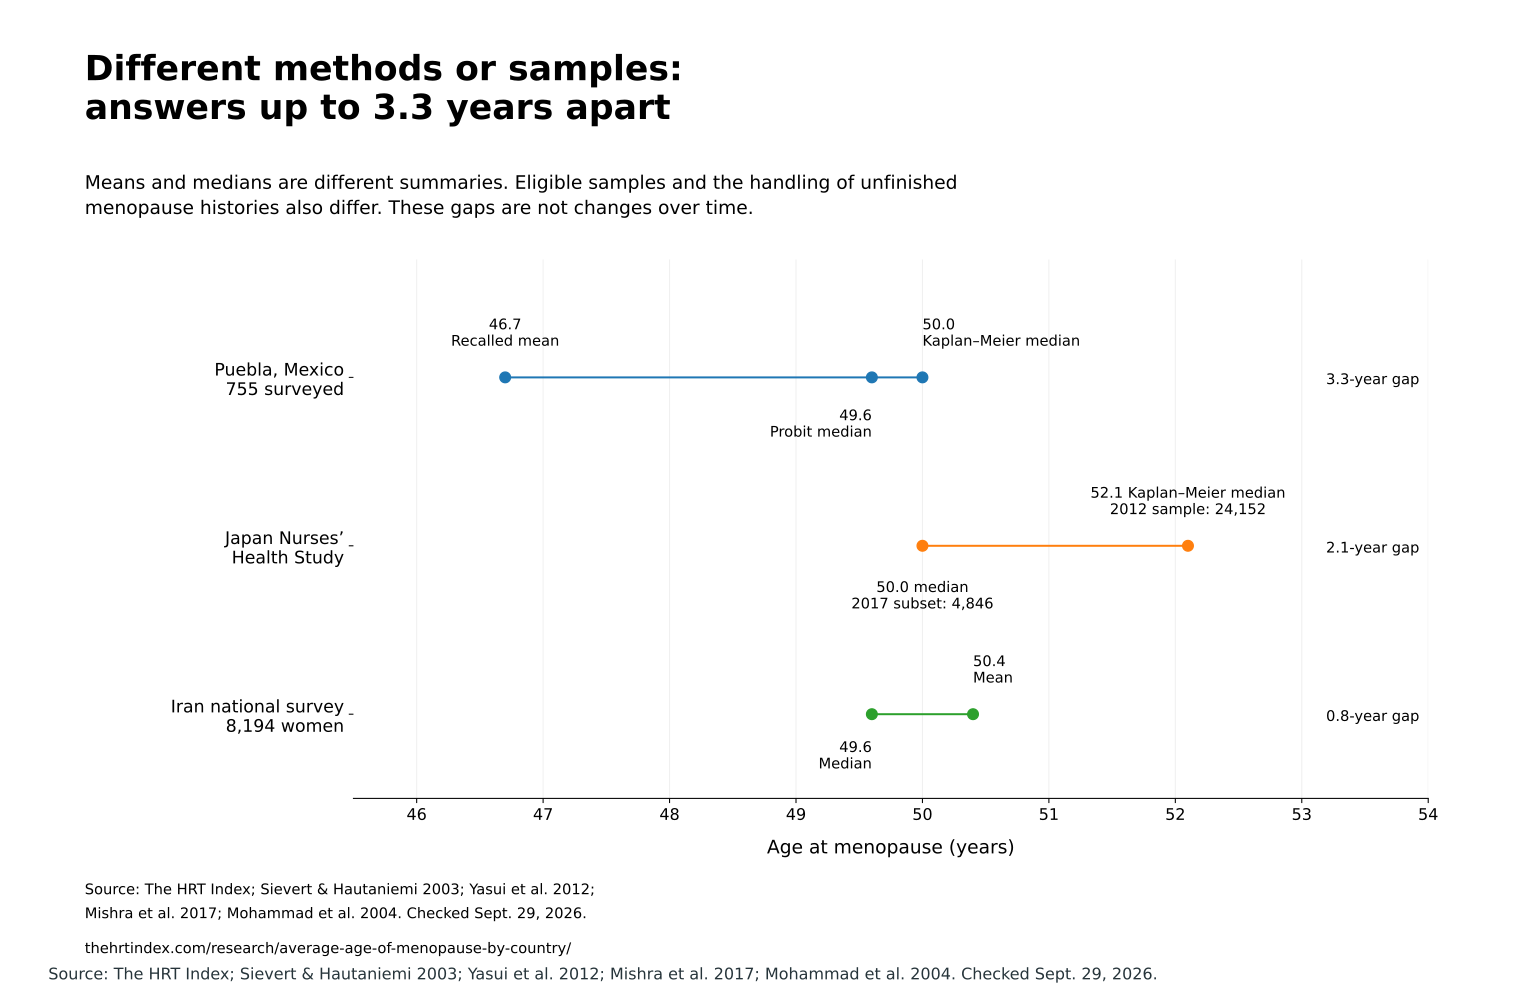
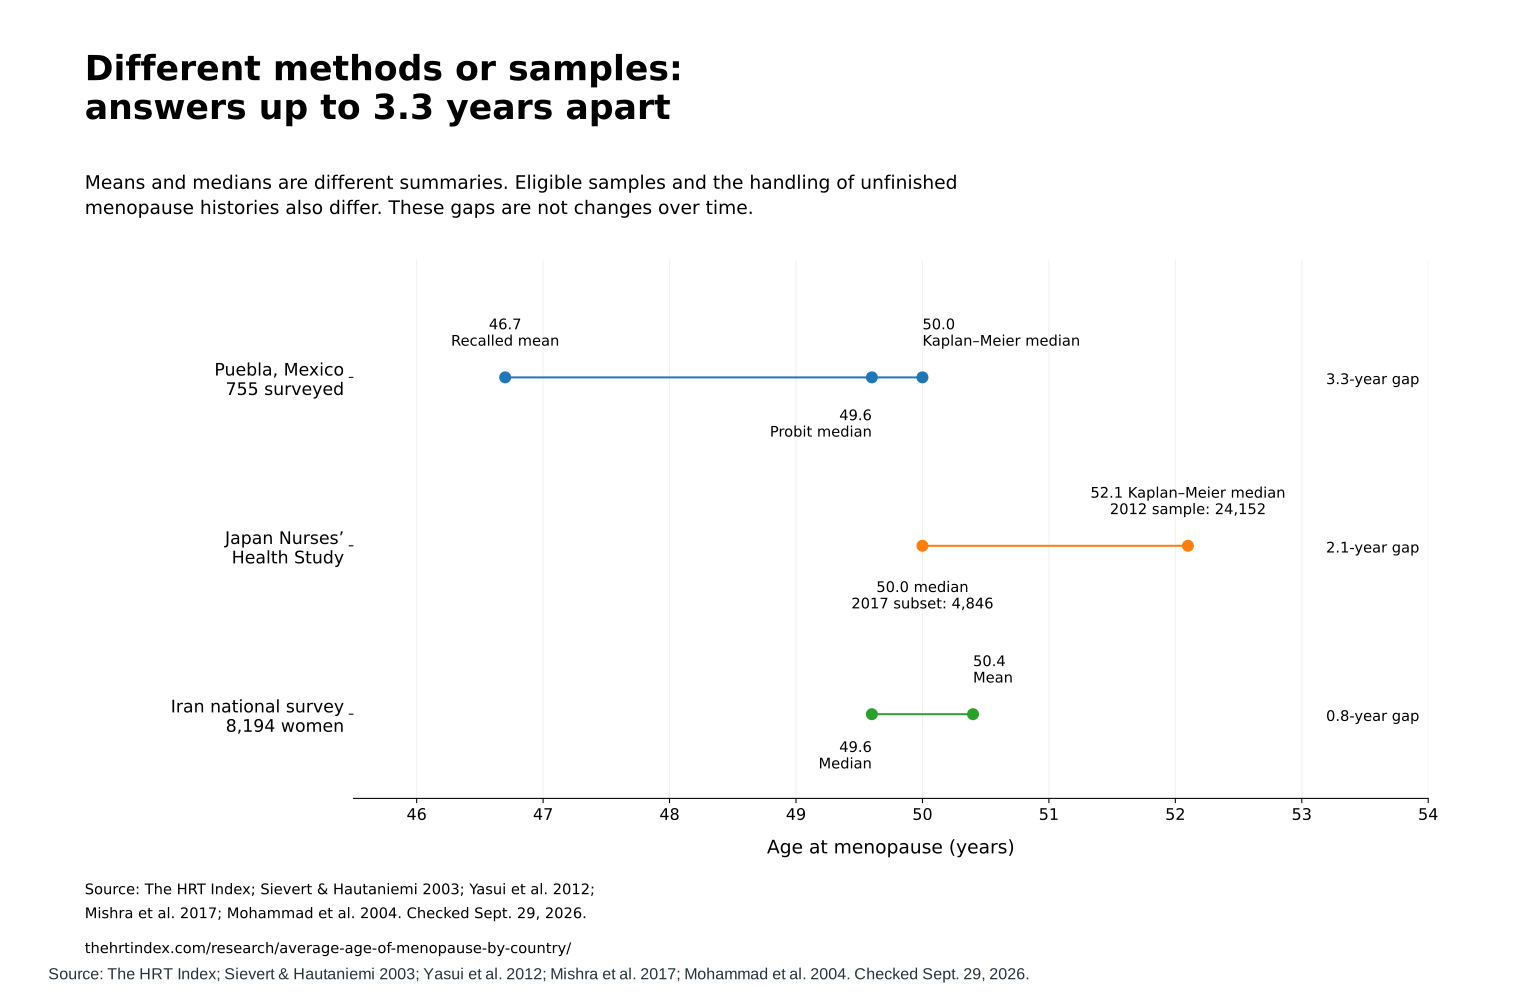
- Same survey, 3.3 years apart. A survey of 755 women in Puebla, Mexico produced 46.7 (remembered ages, averaged), 49.6 (probit median) and 50.0 (Kaplan-Meier median). The methods differ in the summary they estimate and how they use women who have not reached menopause. (Sievert and Hautaniemi, Human Biology, 2003; difference calculated by The HRT Index.)
- One project, a 4.2-year point-estimate gap. Using logit models, DAMES estimated medians of 48.4 in Rabat, Morocco and 52.6 in a Massachusetts health-plan sample. Morocco's published confidence interval is very wide, so 4.2 is a difference between estimates, not a precise population gap. (DAMES studies, 2001–2005; difference calculated by The HRT Index.)
- Norway, later in younger birth groups. Model-estimated mean ages at natural menopause were 50.31 for women born 1936–1939 and 52.73 for women born 1960–1964: a 2.42-year difference. Data were collected in 2006–2014. (Gottschalk et al., Human Reproduction, 2020.)
On this page: Country table · Earliest and latest · Why numbers differ · The Taiwan 44.6 check · Worldwide and by region · Is it getting later? · What changes it · What it means for you · Methods · Cite · Download · FAQ
What is the average age of menopause in each country?
Across the 27 selected country entries, the headline estimate runs from 46.2 (India) to 52.1 (Japan), and 24 of 27 fall between 48 and 52. Each number below comes from one named study, with its sample and whether it is a mean or a median. Some are national surveys; many are one city or one cohort, and the table says which.
Two quick definitions. A mean is the plain average. A median is the middle: half the women reached menopause before that age, half after. In a group with a few very early menopauses, the mean can sit lower than the median.
"Natural menopause" is confirmed after 12 months in a row without a period, with no other medical or physiological cause and no clinical intervention. It is not the start of perimenopause or symptoms. (WHO.)
Table 1. Average age of menopause by country: selected original-study estimates
| Country | Headline age | Mean | Median | Who was studied | Sample size* | Study |
|---|---|---|---|---|---|---|
| Australia | 51 | 51.0 | 51 | Women born 1946–1951, national cohort (ALSWH) | 6,327 | Mishra 2017 |
| Brazil | 51.2 | 51.2 | — | One city: Campinas | 456 | Pedro 2003 |
| Canada | 51 | — | 51 | National cohort analysis, women aged 40+ (CLSA) | 7,719 | Costanian 2018 |
| China | 48.2 | 48.2 | — | 10 regions (China Kadoorie Biobank) | 141,789 | Wang 2022 |
| Czechia | 51 | — | 51 | Six Czech towns (HAPIEE) | 3,689 | Stepaniak 2013 |
| Denmark | 50 | 49.4 | 50 | Nurses (Danish Nurse Cohort) | 8,885 | Mishra 2017 |
| Ghana | 49.5 | 49.5 | — | Achimota Hospital outpatients, Accra; conference abstract | 296 | Kontor 2024 |
| India | 46.2 | 46.2 | — | 21 cities, clinic network | 1,415 | Ahuja 2016 |
| Iran | 49.6 | 50.4 | 49.6 | National Health Survey, 2000 | 8,194 | Mohammad 2004 |
| Italy | 51.2 | 51.2 | — | Menopause-clinic network, 1997–2003; natural menopause | 31,834 | Parazzini 2007 |
| Japan | 52.1 | — | 52.1 | Nurses aged 40+ (JNHS) | 24,152 | Yasui 2012 |
| Lebanon | 49.3 | — | 49.3 | One city: Beirut | 298 | Reynolds 2001 |
| Malaysia | 50 | 49.4 | 50 | One state: Kelantan | 326 | Dhillon 2006 |
| Mexico | 49.6 | 46.7 (remembered ages) | 49.6 | One city: Puebla | 755 | Sievert 2003 |
| Morocco | 48.4 | — | 48.4 | Rabat; model estimate with a wide confidence interval | 299 | Reynolds 2003 |
| Nigeria | 48.0 | 48.4 | 48.0 | Yoruba women at least five years postmenopausal; type exclusions not stated in abstract | 563 | Okonofua 1990 |
| Poland | 52 | — | 52 | One city: Krakow (HAPIEE) | 4,593 | Stepaniak 2013 |
| Russia | 50 | — | 50 | One city: Novosibirsk (HAPIEE) | 4,394 | Stepaniak 2013 |
| Singapore | 49.0 | 49.0 | — | Citizens aged 45–60; natural-menopause subgroup of respondents | 1,000 invited; 69.9% responded* | Loh 2005 |
| South Korea | 49.3 | 49.3 | 49.3 | National surveys (KNHANES), 2001–2014; natural menopause | 12,761 | Park 2018 |
| Spain | 51.7 | — | 51.7 | One city: Madrid | 300 | Reynolds 2005 |
| Sri Lanka | 48.4 | 48.37 | — | One area: Gampaha district | 126 | Premasinghe 2025 |
| Taiwan | 50 | — | 50 | National survey, three phases (NAHSIT) | 4,111 | Shen 2019 |
| Turkey | 46.4 | 46.4 | — | Five cities in four regions, August–November 2005 (IPPOT) | 724 | Kara 2007 |
| United Kingdom | 50 | 50.1 | 50 | England, ages 50+ (ELSA) | 3,516 | Mishra 2017 |
| United States | 49.6 | 49.9 | 49.6 | National survey, 2015–2018 | 973 | Appiah 2021 |
| Vietnam | 49.9 | 49.9 | — | One hospital: Thai Nguyen, 2025 | 610 | Hoang 2026 |
Source: Source:* The HRT Index Menopause Age by Country Evidence Table, version 1.1, checked September 29, 2026, from the studies linked in each row. "Headline age" is the study's median where it reports one, otherwise its mean, displayed to at most one decimal place. Original precision stays in the mean and median columns. "—" means the statistic was not reported or was not recovered in the source we read. These are study estimates, not a country ranking.
Table 1 · Country lookup
Check a country's source record
Estimates are shown as reported, not averaged across studies.
Table 1 headline
Nutrition and Health Survey in Taiwan (three phases)
Median age50yearsMean ageNot reported- Source geography
- national survey
- Menopause type
- natural menopause
- Reported sample size (as sourced)
- 4111
- Eligible population / denominator
- women aged 35 and over
- n basis
- analysis sample
- Menopause events
- Not reported
- Estimate method
- life-table median
- Observation period
- 1993-1996; 1999-2000 elderly survey; 2005-2008
- Source access
- original abstract
- Location in source
- Abstract
- Verification
- original abstract; survey phases in author institutional record
- Checked
- 2026-09-29
Limitation: Estimated median for eligible women in three historical survey phases, not a new 2026 measurement.
Source note: Survey phases verified in the authors institutional record: https://researchoutput.ncku.edu.tw/en/publications/secular-trends-and-associated-factors-of-age-at-natural-menopause/
Overlap: Do not sum sample sizes across records; cohorts, subsets and summaries can overlap.
Sample-size note. Sample sizes mean different things: some count women already past menopause, while others include women still having periods. Singapore reports invitations, not the number whose menopause ages were averaged. The CSV defines each denominator. Nigeria's inspected abstract does not state whether surgical menopause was excluded. Norway and Egypt have additional estimates below; the mixed-type Pakistan result belongs in the source check.
Selected study estimates for 27 countries in alphabetical order. 24 fall between ages 48 and 52; India 46.2 and Turkey 46.4 fall below, and Japan 52.1 above. Italy is 51.2 and South Korea 49.3. This is not a country ranking.
Source: Source: The HRT Index, original studies cited in Table 1. Checked Sept. 29, 2026. thehrtindex.com/research/average-age-of-menopause-by-country/
What is the average age of menopause in India?
The pan-India survey figure used here is 46.2 years, the mean for 1,415 women with natural menopause in an Indian Menopause Society survey across 21 cities (2016). It is the lowest headline figure in this table. The same survey reported 45.6 when 292 women with surgical menopause were counted too, and World Population Review lists the same rounded 45.6 for India. (Ahuja 2016.)
Heads-up: this survey recruited women through doctors, so it is not a random sample of all Indian women.
What is the average age of menopause in Japan?
Japan's headline figure is 52.1 years, the estimated median for 24,152 nurses aged 40 and older in the Japan Nurses' Health Study (2012). It is the highest headline figure here. A later analysis of the cohort gives a median of 50 for 4,846 women with natural menopause and complete analysis variables. A rural cohort surveyed from 1992 to 1995 reported a mean of 48.3, but it combined natural, surgical and unknown menopause types. (Yasui 2012; Mishra 2017; Amagai 2006.)
Three reported numbers, one country—but not the same menopause definition or sample. The next section explains why.
What is the average age of menopause in China?
The China Kadoorie Biobank found a mean age at natural menopause of 48.2 years among 141,789 women in 10 urban and rural regions, using data collected in 2004–2008 and published in 2022. That is one of the largest single samples on this page. It covers 10 selected regions, not a random sample of the whole country. (Wang 2022.)
What is the average age of menopause in the United States?
Federal survey data from 2015 to 2018 put the US mean at 49.9 years and the median at 49.6 (973 women aged 40 to 74). The US Office on Women's Health uses 52 and Mayo Clinic uses 51; our US guide explains which number fits which question. The survey analysis left out menopause before 40 or after 62, and women whose race or ethnicity was not recorded as Black, White or Hispanic. (Appiah 2021.)
What is the average age of menopause in the UK?
In the English Longitudinal Study of Ageing, women past natural menopause had a mean age of 50.1 and a median of 50 (3,516 women, reported 2017). Other UK cohorts land close by: means of 49.3 to 50.7 across four cohorts, and a median of 49.0 in a separate GP-based cohort of 3,650 women.
Table 2. UK estimates side by side
| UK study | Mean | Median | Women | Note |
|---|---|---|---|---|
| English Longitudinal Study of Ageing (ELSA) | 50.1 | 50 | 3,516 | England, ages 50+ |
| MRC National Survey of Health and Development | 50.7 | 51 | 572 | Born in 1946 |
| National Child Development Study | 49.3 | 50 | 1,907 | Born in 1958 |
| UK Women's Cohort Study | 49.4 | 50 | 7,290 | Volunteer cohort |
| RCGP Oral Contraception Study | — | 49.0 | 3,650 | GP-recruited cohort |
Source: Source:* Mishra et al., Human Reproduction, 2017, Table III; Pokoradi et al., American Journal of Obstetrics and Gynecology, 2011. Checked September 29, 2026.
What is the average age of menopause in Canada?
The Canadian Longitudinal Study on Aging found an estimated median age at natural menopause of 51 among 7,719 women aged 40 and older in its Tracking baseline analysis (published 2018). It is a national cohort, and the figure was reported to the whole year. (Costanian et al..)
What is the average age of menopause in Australia?
In the Australian Longitudinal Study on Women's Health, women born 1946 to 1951 who had reached natural menopause had a mean and median of 51 (6,327 women). A Melbourne cohort had a mean of 49.7 and a median of 50 (12,185 women). A separate survival analysis of the same national cohort, which also includes women still having periods, estimated a median of 52 among 8,649 eligible women followed from 1996 to 2007. (Mishra et al., 2017; Berecki-Gisolf et al., 2009.)
What is the average age of menopause in Taiwan?
An analysis of Taiwan's national Nutrition and Health Survey estimated a median age at natural menopause of 50 years (4,111 women aged 35 and older; published 2019). It used the 1993–1996 and 2005–2008 surveys and the 1999–2000 elderly survey. Younger birth groups were associated with later menopause. (Shen et al.; survey phases in the authors' record.) If you have seen 44.6 for Taiwan, here is where that number matches up.
What do the additional Norway and Egypt estimates show?
Norway's study also reports an observed mean of 51.10 among 205,731 women who had reached natural menopause. That is separate from the model estimates for birth groups below. In Alexandria, Egypt, a 1999 community study reported a mean of 46.70 among 289 naturally menopausal women. Both belong in the wider evidence file; neither is a current nationwide estimate. (Gottschalk et al., 2020; Hidayet et al., 1999.)
Do urban and rural estimates differ within China?
A 2014 China Kadoorie Biobank analysis found a mean of 48.5 in selected urban regions and 48.0 in selected rural regions—a 0.5-year gap. It included 83,791 naturally menopausal women aged at least 57, using 2004–2008 data. These are unadjusted study means, not evidence that moving to a city delays menopause.
Table 1a. China: the same study's urban and rural estimates
| Study group | Mean age, years | Women |
|---|---|---|
| Selected urban regions | 48.5 | 41,190 |
| Selected rural regions | 48.0 | 42,601 |
| Combined eligible sample | 48.2 | 83,791 |
Source: Source:* Lewington et al., International Journal of Epidemiology, 2014, Table 1 and footnote c. The combined row already includes the other two. Difference calculated by The HRT Index; checked September 29, 2026.
Which country has the earliest and latest menopause?
Among the 27 countries here, India has the lowest headline figure (46.2) and Japan the highest (52.1), but those two studies used different methods. More comparable studies use similar methods in several places. Their point estimates differ by 4.2 years between Rabat and Massachusetts, and by 2 years between Novosibirsk and Krakow.
Why not just rank all 27? Because a ranking would mix national surveys with one-city samples, and means with medians. The two tables below use more similar methods, but sampling and uncertainty still matter.
Table 3. One survey method, four places (DAMES)
| Place | Median age at natural menopause | Women |
|---|---|---|
| Massachusetts, United States | 52.6 | 293 |
| Madrid, Spain | 51.7 | 300 |
| Beirut, Lebanon | 49.3 | 298 |
| Rabat, Morocco | 48.4 | 299 |
Source: Source:* Reynolds and Obermeyer: Spain and US, 2005; Lebanon, 2001; Morocco, 2003. All women were 45 to 55; medians estimated by logit models. Gap: 52.6 − 48.4 = 4.2 years between point estimates, calculated by The HRT Index. Morocco's paper reports a wide 95% confidence interval of 36.9–70.3; that is not a normal age range or proof of a precise 4.2-year population difference. The Massachusetts sample came from a health plan. Checked September 29, 2026.
Table 4. One study, three Central and Eastern European urban populations (HAPIEE)
| City | Median age at natural menopause | Women in sample | Share with natural menopause |
|---|---|---|---|
| Krakow, Poland | 52 | 4,593 | 66.9% |
| Six Czech towns | 51 | 3,689 | 71.4% |
| Novosibirsk, Russia | 50 | 4,394 | 77.2% |
Source: Source:* Stepaniak et al., Maturitas, 2013, Table 1. Kaplan-Meier medians. These are city samples, not national estimates. Checked September 29, 2026.
Inside a single region, the spread can be even wider. A survey of 17,150 women in 47 Latin American cities found medians from 43.8 in Asunción, Paraguay to 53 in Cartagena, Colombia. That is 9.2 years between two cities on the same continent (Castelo-Branco et al., Menopause, 2006).
Why do sources give different ages for the same country?
Mostly because of how the age is measured and who gets counted. In one survey of 755 women in Puebla, Mexico, different ways of analyzing the survey produce 46.7, 49.6 or 50.0. That 3.3-year swing is bigger than the gap between many countries.
Here are the five things that move the number.
1. Averaging remembered ages vs estimating a median. Ask only women who already reached menopause when it happened, then average their answers, and you can get a lower number. Women still having periods are left out of that average. Methods such as Kaplan-Meier and probit can also use women who have not reached menopause. They estimate a different summary and can give a higher answer. In Puebla, the remembered-age average was 46.7; the two statistical medians were 49.6 and 50.0.
2. Who is still in the count. The Japan Nurses' Health Study shows it within one cohort. The 2017 analysis of 4,846 women with natural menopause and complete analysis variables gives a median of 50. The separate 2012 analysis of 24,152 nurses aged 40 and older estimates 52.1. The samples and methods both differ.
3. Surveying younger women drags the average down. In Iran's Fasa cohort, women aged 65 to 75 reported a mean age at menopause of 52.27; women aged 35 to 44 who had already stopped reported 40.25. That comparison cannot establish that menopause shifted 12 years earlier across generations. Among women aged 35–44, only those whose menopause had already happened can report its completed age. The paper itself gives conflicting versions: its abstract and first Results paragraph report 52.27 and 40.25, while a later Results paragraph gives 54.49 and 40.16 for the same age-group contrast. We preserve that conflict rather than calling either pair a measured generational shift. (Bazyar et al., 2025.)
4. Mixing in surgical menopause. India's survey gives 46.2 for natural menopause and 45.6 when surgical cases are added. The Karachi study that matches the popular "44.6" mixed both types too.
5. Where women were found. In Italy, a national sample from general practitioners gave a mean of 50.2 (16,916 women). Samples from menopause clinics gave 50.9 and 51.2, with different years and rules, too. Those clinic studies specify spontaneous menopause; the GP study's abstract does not establish whether surgical menopause was excluded. That is why Table 1 uses the 51.2 clinic figure. (Amigoni 2000; Meschia 2000; Parazzini 2007.)
Table 5. Related study data, different methods or samples
| Study | Method | Age | Women |
|---|---|---|---|
| Puebla, Mexico | Remembered ages, averaged | 46.7 | 755 surveyed |
| Puebla, Mexico | Probit median | 49.6 | 755 surveyed |
| Puebla, Mexico | Kaplan-Meier median | 50.0 | 755 surveyed |
| Japan Nurses' Health Study | Median, women already past menopause | 50 | 4,846 |
| Japan Nurses' Health Study | Kaplan-Meier median, eligible nurses 40+ | 52.1 | 24,152 |
| Iran National Health Survey | Median | 49.6 | 8,194 |
| Iran National Health Survey | Mean | 50.4 | 8,194 |
Source: Source:* Sievert and Hautaniemi, Human Biology, 2003; Mishra et al., 2017 and Yasui et al., 2012; Mohammad et al., Maturitas, 2004. Checked September 29, 2026.
Puebla results run from a recalled mean of 46.7 to an estimated median of 50.0. Different JNHS samples have medians of 50.0 and 52.1. Iran's mean of 50.4 is higher than its median of 49.6. Methods and eligible samples differ; means are not always lower.
Source: Source: The HRT Index; Sievert & Hautaniemi 2003; Yasui et al. 2012; Mishra et al. 2017; Mohammad et al. 2004. Checked Sept. 29, 2026.
Where does Taiwan's "44.6" come from?
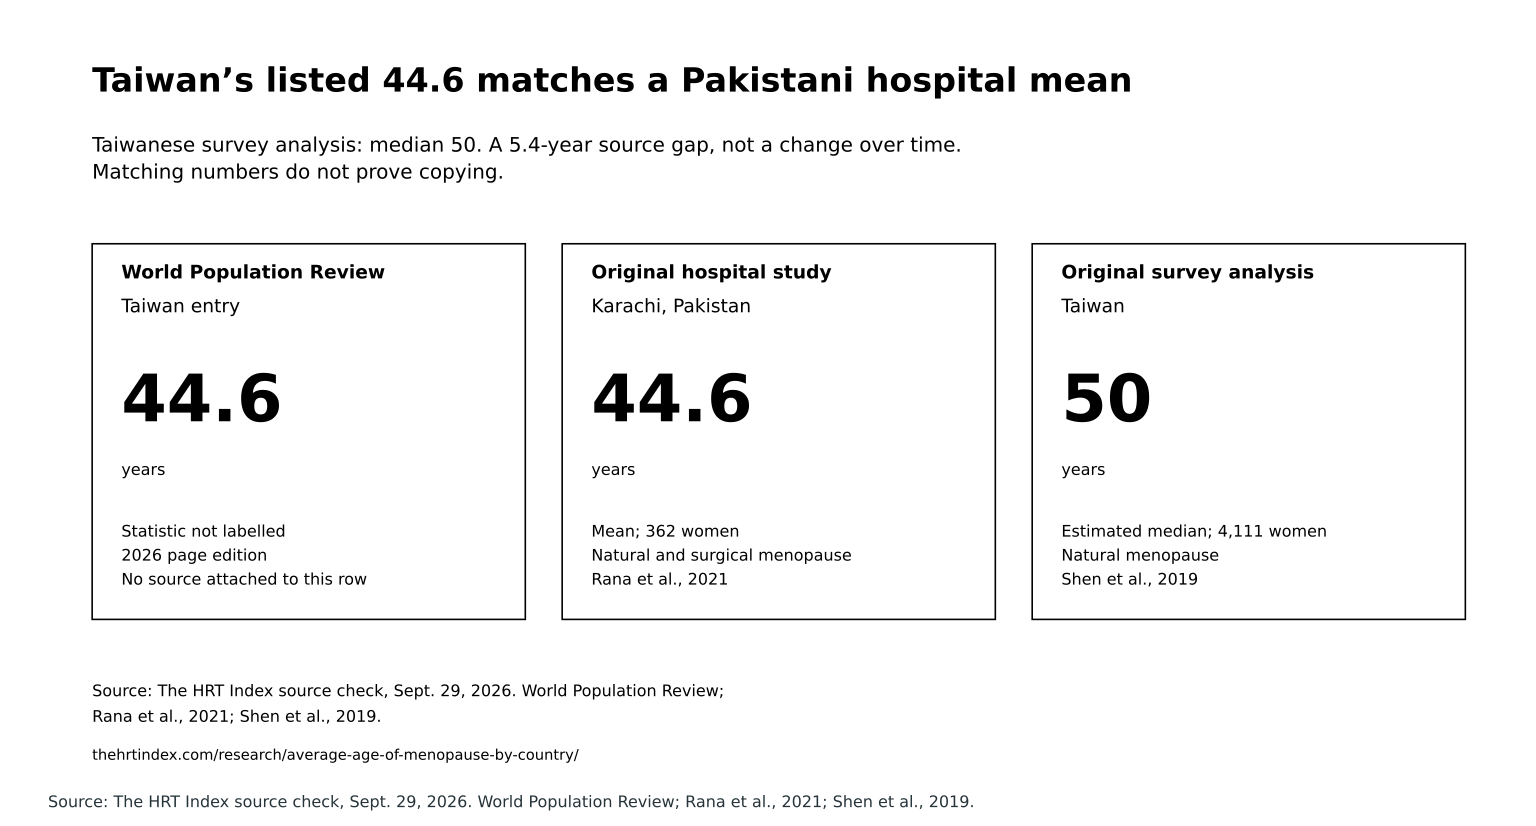
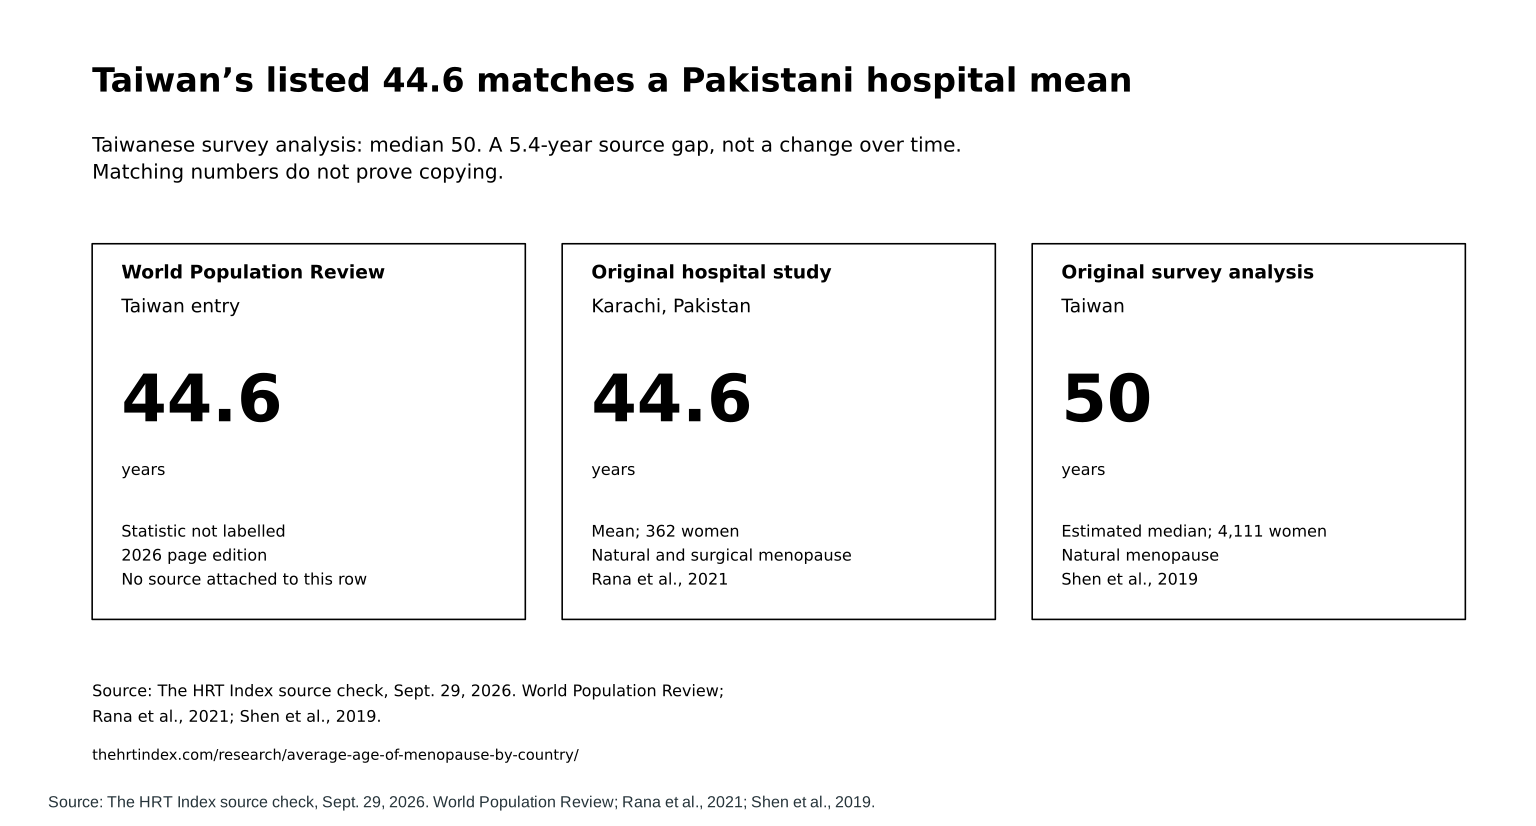
World Population Review lists Taiwan at 44.6 without a source attached to that row. One of its listed sources, a 2021 study of 362 women at a hospital in Karachi, Pakistan, reports the same mean and mixes natural and surgical menopause. A Taiwanese national-survey analysis estimates a median of 50: a 5.4-year source gap , not a change over time.
The table is World Population Review's "Age of Menopause by Country 2026." We checked it on September 29, 2026. It lists 130 countries and territories and 12 sources.
Here is what the Taiwan row shows, step by step:
- The table gives Taiwan 44.6, its lowest value, and gives Pakistan 48.0.
- No source is attached directly to the Taiwan row. The general source list does not tell the reader which study produced that entry.
- One listed source is a 2021 study from Ziauddin University in Karachi. Its abstract reports a mean of 44.6 for 362 women, with natural and surgical menopause combined. This is a verified match between two published numbers, not proof of how the table obtained its Taiwan value.
- Taiwan's own national survey data (4,111 women) give a median of 50 for natural menopause.
A matching number does not prove that anyone swapped or copied it. The defensible finding is narrower: the table does not identify a study for its Taiwan row, a listed Karachi paper reports the same 44.6, and an original Taiwanese survey analysis reports a median of 50.
Table 6. What the popular table says vs the original studies we checked
| Country | Popular table | What the source shows | Traced study figure |
|---|---|---|---|
| Taiwan | 44.6 | No study is attached to the row. One listed Karachi paper reports mean 44.6 for natural and surgical menopause combined | 50 (estimated median, Taiwanese survey analysis, 4,111 women) |
| India | 45.6 | Matches the rounded 45.59 combined-type mean in a listed study, including 292 surgical menopauses | 46.2 (mean, natural menopause only) |
| Norway | 52.7 | Matches model-estimated mean 52.73 for women born 1960–1964 | 50.31 for the 1936–1939 group; 51.10 observed mean across all completed natural menopauses |
| United States | 51.4 | A separate SWAN paper reports adjusted median 51.4; listed DAMES reports 52.6 for a Massachusetts sample | 51.4 (SWAN, 2001); 49.9 mean and 49.6 median in the 2015–2018 national-survey analysis |
| Brazil | 51.2 | Matches the independently checked Pedro study, not directly named in the table's source list: 456 women in Campinas | 51.2 (one city) |
| Argentina, Chile, Colombia and Peru (examples) | 51.0 each | A separate 15-country urban survey estimated a pooled median of 48.6, with cities from 43.8 to 53 | 48.6 (estimated urban pooled median, 17,150 women), not a replacement national value |
Source: Source:* World Population Review, Age of Menopause by Country 2026, checked September 29, 2026; Rana et al., 2021; Shen et al., 2019; Ahuja, 2016; Gottschalk et al., 2020; Reynolds and Obermeyer, 2005; Gold et al., 2001; Appiah et al., 2021; Pedro et al., 2003; Castelo-Branco et al., 2006.
World Population Review lists Taiwan at 44.6. A Karachi study reports the same mean for natural and surgical menopause combined. A Taiwanese survey analysis estimates a natural-menopause median of 50. The 5.4-year gap does not show a time trend or prove copying.
Source: Source: The HRT Index source check, Sept. 29, 2026. World Population Review; Rana et al., 2021; Shen et al., 2019.
How much of that table can be traced?
121 of the table's 130 values are whole numbers, and 12 sources are listed without citations attached to individual rows. The value 51.0 appears 32 times, from Canada to Greenland to the Falkland Islands. 49.0 appears 37 times, 48.0 appears 30 times, and 47.0 appears 15 times.
It also has no row for the United Kingdom, Germany, France, Italy, the Netherlands, Sweden, Denmark, Poland, Ukraine, Portugal, Belgium, Austria, Switzerland or Ireland.
To be fair, round doesn't mean wrong. For the 22 countries that appear in both that table and ours, 16 are within one year of the traced study. The six bigger gaps are Taiwan (5.4 years), Mexico (2.6), Japan (2.1), China (1.8), the United States (1.8) and Ghana (1.5). These are comparisons of differently defined study figures, not an accuracy test. The problem is that the table does not identify each row's study, statistic, sample and observation period. The downloadable listing snapshot includes all 130 entries and the 22 overlaps.
Is that the only country table with a sourcing problem?
No. A second online dataset, Kindr Health's eight-country "Median Age of Natural Menopause by Country" table, links its source line to PubMed record 32359771. That record is a 2020 paper about COVID-19 drugs and heart-rhythm risk. That doesn't prove its ages are wrong. It means the link can't back them up.
What is the average age of menopause worldwide and by region?
A 2014 meta-analysis of 36 community-based studies put the pooled mean at 48.8 years (95% CI 48.3 to 49.2). Studies from Europe and Australia tended to show the latest ages, and studies from Latin America, the Middle East, Africa and Asia the earliest. The World Health Organization says most women reach menopause between 45 and 55.
The full review covered 46 study populations in 24 countries; 36 studies contributed to the 48.8 mean. Those study means ranged from 46 to 52. The studies varied so much (a heterogeneity score of 99.6%, near the maximum of 100%) that the pooled figure is a rough center, not a precise world average.
Table 7. How regions compared with Europe in the global meta-analysis
| Region | Difference from Europe (years) | 95% confidence interval |
|---|---|---|
| Australia | +0.77 | −0.69 to +2.22 |
| United States | −1.25 | −2.22 to −0.28 |
| Asia | −1.62 | −2.53 to −0.72 |
| Africa | −2.35 | −3.58 to −1.12 |
| Middle East | −3.12 | −4.05 to −2.20 |
| Latin America | −3.22 | −4.42 to −2.02 |
Source: Source:* Schoenaker et al., International Journal of Epidemiology, 2014, Table 3, adjusted study-level meta-regression. A minus sign means earlier than the European studies. These are model comparisons between studies, not differences between every woman in those regions. Australia's interval crosses zero; the paper also adjusts its significance tests for multiple comparisons. Checked September 29, 2026.
A second pooled look, nine cohorts from Australia, Denmark, Japan, Sweden/Norway and the United Kingdom, found a mean of 49.9 and a median of 50 among women who had reached natural menopause (Mishra et al., 2017). These are selected cohorts, including one combined Sweden/Norway cohort, so it isn't a world average either.
Africa, in brief. The global meta-analysis put African studies about 2.35 years earlier than European ones. The African studies in our table show 48.0 (median) and 48.4 (mean) in Nigeria, 48.4 in Morocco, and 49.5 in one district of Accra, Ghana.
Is menopause happening later than it used to?
Several studies report later natural menopause in younger birth groups or later survey periods. In Norway, the model-estimated mean rose from 50.31 for women born 1936 to 1939 to 52.73 for women born 1960 to 1964. In US federal survey data, the mean rose from 48.4 in 1959 to 1962 to 49.9 in 2015 to 2018.
Table 8. US age at natural menopause, eight survey periods
| Survey period | Mean | Median | Women |
|---|---|---|---|
| 1959–1962 | 48.4 | 48.5 | 708 |
| 1971–1975 | 49.1 | 49.2 | 1,271 |
| 1988–1994 | 49.2 | 49.3 | 1,349 |
| 1999–2002 | 49.4 | 49.2 | 730 |
| 2003–2006 | 49.9 | 49.4 | 717 |
| 2007–2010 | 49.9 | 49.6 | 1,065 |
| 2011–2014 | 49.9 | 49.6 | 960 |
| 2015–2018 | 49.9 | 49.6 | 973 |
Source: Source:* Appiah et al., JAMA, 2021, survey-weighted estimates for women aged 40 to 74; women counts unweighted. The analysis left out menopause before 40 or after 62, and race or ethnicity other than Black, White or Hispanic. The authors reported the 1.5-year rise themselves. Checked September 29, 2026.
Notice that the rounded US means are all 49.9 from 2003–2006 through 2015–2018. This series does not show what happened after 2018, and identical one-decimal values do not prove the unrounded estimates were identical.
Table 8a. Norway: model estimates by birth group
| Birth group | Estimated mean, years | 95% confidence interval | Women in birth-group sample |
|---|---|---|---|
| 1936–1939 | 50.31 | 50.25–50.37 | 17,409 |
| 1940–1944 | 50.80 | 50.76–50.83 | 45,831 |
| 1945–1949 | 50.70 | 50.66–50.73 | 63,716 |
| 1950–1954 | 50.93 | 50.90–50.97 | 70,507 |
| 1955–1959 | 51.86 | 51.80–51.91 | 72,789 |
| 1960–1964 | 52.73 | 52.64–52.82 | 42,404 |
Source: Source:* Gottschalk et al., Human Reproduction, 2020, Table II. Restricted-mean survival estimates through age 71, from data collected in 2006–2014. Samples include women who had not yet reached natural menopause. These are not simple averages of completed events. Checked September 29, 2026.
Other countries point the same way:
- South Korea: mean age at natural menopause rose from 47.9 (born 1929 or earlier) to 50.5 (born 1945 to 1949) among 12,761 women (Park et al., Menopause, 2018).
- Taiwan: women from younger birth cohorts reached natural menopause later; the hazard ratio was 0.87 per 10-year birth difference (Shen et al., Menopause, 2019). Here, a hazard ratio below 1 means a lower estimated rate of reaching menopause at a given age, consistent with later timing.
It isn't a smooth line everywhere. In Norway, women born 1945 to 1949 broke the rising pattern before it resumed (Gottschalk et al., 2020). And the reasons aren't settled; the studies describe the change without proving what caused it.
What makes menopause earlier or later?
Education, smoking, income and altitude are linked to menopause timing at the population level. Across studies, women with high education reached natural menopause about 0.64 years later than women with low education. Table 4 of the same review reports a smoking hazard ratio of 1.32—an estimated 32% higher rate of reaching menopause at a given age. In the Latin American study, women aged 49 living at 2,000 meters or higher had about twice the odds of having reached menopause.
Table 9. Factors linked to menopause timing
| Factor | What the study found | Study |
|---|---|---|
| Education, high vs low | About 0.64 years later | Schoenaker et al., 2014 (meta-analysis) |
| Education, middle vs low | About 0.30 years later | Schoenaker et al., 2014 |
| Current smoking | Hazard ratio 1.32: menopause tends to come earlier | Schoenaker et al., 2014 (12 studies) |
| Living at 2,000 m or higher (women aged 49) | Odds ratio 2.0 for having reached menopause | Castelo-Branco et al., 2006 |
| Living in a country with lower gross national product (women aged 49) | Odds ratio 2.1 for having reached menopause | Castelo-Branco et al., 2006 |
| Lower education (Latin American women aged 49) | Odds ratio 1.9 for having reached menopause | Castelo-Branco et al., 2006 |
Source: Source:* Schoenaker et al., 2014; Castelo-Branco et al., Menopause, 2006. These are associations in groups of women. They don't prove cause and they can't predict one person's age. Checked September 29, 2026.
The global review found differences by region and associations with schooling and smoking. That's a pattern across study groups, not a rule for any one country or woman.
The review has a small internal mismatch: its smoking table reports a hazard ratio of 1.32 (95% CI 1.25–1.40), while the prose reports 1.33 (1.26–1.40). Table 9 uses the table value; the supporting-statistics CSV preserves that choice. An odds ratio of 2 does not mean twice the probability.
What does your country's average mean for you?
Not much for predicting your own date. The World Health Organization says it is not possible to predict when an individual woman will reach menopause. Most women reach it between 45 and 55, and menopause before 40 is called premature menopause. (WHO.)
A country number describes a group. Your own timing depends on your health, history and family, and no table can give you a date.
Where the average does help is spotting when something is unusual. If your periods have stopped before 45, that's worth checking with a clinician whatever your country's average is. (NHS guidance.) Our guide to premature menopause vs primary ovarian insufficiency explains the difference, and care options for early menopause covers where to get treated. If you're still having periods well into your mid-50s, see late-onset menopause.
For the US numbers in detail, including why public health guides use 51 or 52, see the average age of menopause in the US. To bring this up with a doctor, here's how to ask your doctor about HRT.
If you're in the US and deciding where to get help with symptoms, Find My HRT Path is our free tool that sorts care options by your situation. It doesn't predict menopause age.
How we built this
We read original publications and recorded what each estimate measured, instead of copying medical ages from other country tables. The evidence file holds 75 study, subgroup or pooled-estimate records from 37 publications . Table 1 selects one record for each of 27 countries; the wider file also contains additional countries, mixed-type comparisons, birth groups and pooled results. Each public record was checked on September 29, 2026.
What we collected. Published estimates of menopause age from national surveys, population cohorts, and city or clinic studies. For each one we recorded the mean and median separately, the spread, the sample definition, the method, the years, the birth group, the publication, the link, and a plain limitation. Natural-only estimates are distinguished from mixed-type or unresolved-type records.
How we picked each country's headline row. This is a selected reference table, not an exhaustive systematic review or a claim that these are the best studies for every country. Table 1 covers the 27 countries in this edition. Within that set, we used the larger, explicitly natural-only Italian clinic study and the larger, newer Korean natural-menopause analysis already among the collected papers. The headline age is the selected study's median where it reports one, otherwise its mean. The original mean and median stay separate; the headline rounds to at most one decimal place.
What we checked directly. We read full articles or their complete relevant results tables for InterLACE, HAPIEE, the US survey series, Norway, India, Iran's Fasa cohort, Japan's Jichi cohort, the global meta-analysis and both China Kadoorie Biobank papers. Other rows were checked against the study's own original abstract or publisher record, not a search snippet. Ghana is a conference abstract rather than a full report. Canada's and Australia's additional results now link to their original study abstracts. Taiwan's survey phases were also checked in the authors' institutional record. The CSV labels the source location and access depth for every row.
What we left out of Table 1, or kept separate.
- Pakistan. The 44.6 study mixes natural and surgical menopause, so it belongs in the source check, not a natural-only comparison.
- Egypt and Norway. Verified additional estimates appear above and in the evidence file, outside this edition's fixed 27-country summary. Norway also has a birth-group series; it is not limited to birth-group results alone.
- Sweden/Norway. The original InterLACE table gives one combined cohort label. We do not split it into invented national results.
- Country values found only in other compilations. These remain unpublished leads unless the original study and the specific value can be checked.
Where the popular table fits in. We counted its 130 country and territory rows and its 12 listed sources on September 29, 2026. We checked the original papers behind the comparisons discussed here. The website does not attach a source to each row, so matching numbers are not proof of a copying history. We did not classify rows as sourced merely because a source title named the same country.
How to reproduce this. Open the source link in any evidence-file row and use its source-location field to find the reported estimate. Filter headline_row = yes: there are 27 selected values, 24 from 48 to 52 inclusive, with a median of 49.9 . The calculations file binds the reported differences to record IDs. The listing snapshot contains all 130 online entries and the 22 overlaps; the supporting-statistics file holds the regional coefficients, factor estimates and sample-share inputs. We did not reanalyze individual participants or pool the study means ourselves.
What a blank means. A blank is a value not reported or not recovered from the source we read—not zero. Collection dates remain blank where they were not recovered. Publication years never stand in for missing observation years. Samples overlap, so do not add the participant counts across rows.
This page contains no affiliate links. Its calculations and comparisons are separate from the site's provider recommendations.
What this data does and doesn't show
These are study results for specific groups of women, not official national statistics, and they can't predict one person's menopause. Many rows describe one city, one clinic network or one cohort, and the known observation periods span 1959 to 2025. Publication years are separate.
- It isn't a clean ranking. Means, medians and methods differ, and Table 5 shows that different summaries and sample handling can produce results more than three years apart.
- Most rows aren't national random samples. The "Who was studied" column says which ones are.
- Publication year isn't survey year. A 2019 paper can use data collected years earlier.
- Menopause type matters. Table 1 prioritizes natural-menopause research, but Nigeria's inspected abstract does not resolve surgical exclusions. The wider file includes clearly marked mixed-type studies for comparison. It does not turn them into natural-only estimates.
- Countries are missing. Table 1 is a selected 27-country reference, not a list of every country with research. No row doesn't mean no research.
- It says nothing about symptoms. How strong or long menopause symptoms are is a different question.
- It's not medical advice. A clinician can look at your own history.
How to cite this page
For the page or our findings (the Taiwan check, the 24-of-27 count, the table counts):
The HRT Index Editorial Team. "Average Age of Menopause by Country: 27 Sourced Estimates." The HRT Index Research. Updated September 29, 2026. https://thehrtindex.com/research/average-age-of-menopause-by-country/
For the dataset:
The HRT Index. Menopause Age by Country Evidence Table, version 1.1. September 29, 2026. https://thehrtindex.com/research/average-age-of-menopause-by-country/
For a single country's number, cite the original study linked in its row, and add "via The HRT Index" if you found it here.
Reuse: You may reuse The HRT Index's original text, table arrangement, calculations and newly drawn charts with credit to The HRT Index by name; no link is required or requested. Keep the underlying study citations and any third-party licence terms. This permission does not relicense the original papers, their figures or third-party material in the source files.
Download the data
- Download Country evidence table CSV (75 rows; version 1.1; checked 2026-09-29)
- Download Calculations CSV (22 rows; version 1.1; checked 2026-09-29)
- Download Source check CSV (8 rows; version 1.1; checked 2026-09-29)
- Download Listing snapshot CSV (130 rows; version 1.1; checked 2026-09-29)
- Download Supporting statistics CSV (20 rows; version 1.1; checked 2026-09-29)
Five CSV files, free, no sign-up:
- Country evidence table (CSV): 75 study, subgroup and pooled-estimate records; 27 selected headline country rows.
- Calculations (CSV): 22 count, difference and relative-change records, with formulas and linked inputs.
- Source check (CSV): 8 source-audit records, with conclusions and limits.
- Listing snapshot (CSV): 130 country and territory entries as checked, including the 22 overlaps; secondary website data, not new national medical estimates.
- Supporting statistics (CSV): 20 source-reported regional coefficients, factor estimates and sample-share inputs.
A blank cell means a value was not reported or not recovered in the source we read—not zero. Original-study data, secondary website entries and The HRT Index calculations remain in separate files.
Frequently asked questions
Is it normal to go through menopause at 42 or 43?
It happens, but it's earlier than usual. The World Health Organization says most women reach natural menopause between 45 and 55, and in 24 of the 27 countries in our table, the headline estimate is between 48 and 52. If your periods stop in your early 40s, see a clinician, because other causes need ruling out. (Source 1; Source 2.)
Is it normal to start menopause at 35?
Menopause before 40 is called premature menopause, according to the World Health Organization. A missed period at 35 has many possible causes, so it needs a clinical check rather than a country table. Our guide to premature menopause vs primary ovarian insufficiency explains the difference. (Source 1; Source 2.)
What is the average age of menopause worldwide?
A 2014 meta-analysis of 36 studies put the pooled mean at 48.8 years. The middle of the 27 selected estimates in this edition is 49.9, but that is not a population-weighted world average. WHO says most women reach natural menopause between 45 and 55. (Source 1; Source 2.)
Which country has the earliest menopause?
Among the 27 countries here, India has the lowest headline figure: a mean of 46.2 for natural menopause. Turkey follows at 46.4. One urban study estimated a median of 43.8 in Asunción, Paraguay. This mixed-method collection cannot establish which country truly has the earliest menopause. (Source 1; Source 2.)
Which country has the latest menopause?
Among the 27 countries here, Japan has the highest headline figure: a median of 52.1 among 24,152 nurses. Poland (52, Krakow) and Spain (51.7, Madrid) follow. Norway's often-quoted 52.7 matches a model estimate for women born 1960 to 1964. These selected estimates do not establish a country with the latest menopause worldwide. (Source 1; Source 2.)
How old are women at menopause in Africa?
The African studies in our table show a median of 48.0 and a mean of 48.4 in Nigeria, 48.4 in Morocco, and 49.5 in one district of Accra, Ghana. A global meta-analysis put African studies about 2.35 years earlier than European ones. This edition does not cover every African country; an absent country is a gap in this collection, not proof that no study exists. (Source 1; Source 2; Source 3; Source 4.)
Why do some tables list Taiwan at 44.6?
World Population Review lists Taiwan at 44.6 without a source attached to that row. One listed Karachi, Pakistan study reports the same mean for natural and surgical menopause combined. A Taiwanese national-survey analysis estimates a natural-menopause median of 50; the match does not prove how the table got its value. (Source 1; Source 2; Source 3.)
Is menopause happening later than it used to?
Several studies report later menopause. Norway's model-estimated mean rose from 50.31 to 52.73 across birth groups born in 1936–1939 and 1960–1964. The US survey mean rose from 48.4 (1959–1962) to 49.9 (2015–2018). The causes aren't settled. (Source 1; Source 2.)
Can my country's average predict when I'll reach menopause?
No. The World Health Organization says individual timing can't be predicted. A country figure describes a group of women, not you. (Source 1.)
Sources
Sources checked September 29, 2026. Access varied between full papers, complete results tables and original abstracts, as recorded in the evidence CSV.
- Schoenaker DAJM, Jackson CA, Rowlands JV, Mishra GD. "Socioeconomic position, lifestyle factors and age at natural menopause: a systematic review and meta-analyses of studies across six continents." International Journal of Epidemiology. 2014;43(5):1542–1562.
- Mishra GD, Pandeya N, Dobson AJ, et al. "Early menarche, nulliparity and the risk for premature and early natural menopause." Human Reproduction. 2017;32(3):679–686.
- Stepaniak U, Szafraniec K, Kubinova R, et al. "Age at natural menopause in three Central and Eastern European urban populations: the HAPIEE study." Maturitas. 2013;75(1):87–93.
- Appiah D, Nwabuo CC, Ebong IA, Wellons MF, Winters SJ. "Trends in age at natural menopause and reproductive life span among US women, 1959–2018." JAMA. 2021;325(13):1328–1330.
- Gottschalk MS, Eskild A, Hofvind S, Gran JM, Bjelland EK. "Temporal trends in age at menarche and age at menopause: a population study of 312 656 women in Norway." Human Reproduction. 2020;35(2):464–471.
- Shen TY, Chen HJ, Pan WH, Yu T. "Secular trends and associated factors of age at natural menopause in Taiwanese women." Menopause. 2019;26(5):499–505.
- Rana MY, Kulsoom O, Ali HS, Istiaq S, Sultana S, Hussain R. "Factors influencing the age of menopause among Pakistani women." Journal of the Society of Obstetricians and Gynaecologists of Pakistan. 2021;11(3):214–216.
- Ahuja M. "Age of menopause and determinants of menopause age: a PAN India survey by IMS." Journal of Mid-life Health. 2016;7(3):126–131.
- Wang M, Gan W, Kartsonaki C, et al. "Menopausal status, age at natural menopause and risk of diabetes in China: a 10-year prospective study of 300,000 women." Nutrition & Metabolism. 2022.
- Yasui T, Hayashi K, Mizunuma H, et al. "Factors associated with premature ovarian failure, early menopause and earlier onset of menopause in Japanese women." Maturitas. 2012;72(3):249–255.
- Amagai Y, Ishikawa S, Gotoh T, et al. "Age at menopause and mortality in Japan: the Jichi Medical School Cohort Study." Journal of Epidemiology. 2006;16(4):161–166.
- Castelo-Branco C, Blümel JE, Chedraui P, et al. "Age at menopause in Latin America." Menopause. 2006;13(4):706–712.
- Sievert LL, Hautaniemi SI. "Age at menopause in Puebla, Mexico." Human Biology. 2003;75(2):205–226.
- Reynolds RF, Obermeyer CM. "Age at natural menopause in Spain and the United States: results from the DAMES project." American Journal of Human Biology. 2005;17(3):331–340.
- Reynolds RF, Obermeyer CM. "Age at natural menopause in Beirut, Lebanon: the role of reproductive and lifestyle factors." Annals of Human Biology. 2001;28(1):21–29.
- Reynolds RF, Obermeyer CM. "Correlates of the age at natural menopause in Morocco." Annals of Human Biology. 2003;30(1):97–108.
- Mohammad K, Sadat Hashemi SM, Farahani FKA. "Age at natural menopause in Iran." Maturitas. 2004;49(4):321–326.
- Bazyar N, Moradi Z, Khani Jeihooni A, Dehghan A. "Trends in age at natural menopause and menarche and related factors in Iran: results from a population-based study." Scientific Reports. 2025;15:18311.
- Amigoni S, Morelli P, Chatenoud L, Parazzini F. "Cross-sectional study of determinants of menopausal age and hormone replacement therapy use in Italian women." Climacteric. 2000.
- Parazzini F; Progetto Menopausa Italia Study Group. "Determinants of age at menopause in women attending menopause clinics in Italy." Maturitas. 2007;56(3):280–287.
- Meschia M, Pansini F, Modena AB, et al. "Determinants of age at menopause in Italy: results from a large cross-sectional study." Maturitas. 2000;34(2):119–125.
- Costanian C, McCague H, Tamim H. "Age at natural menopause and its associated factors in Canada: cross-sectional analyses from the Canadian Longitudinal Study on Aging." Menopause. 2018;25(3):265–272. Original study abstract.
- Berecki-Gisolf J, Begum N, Dobson AJ. "Symptoms reported by women in midlife: menopausal transition or aging?" Menopause. 2009;16(5):1021–1029.
- Pedro AO, Pinto Neto AM, Paiva LHSC, Osis MJ, Hardy E. "Age at natural menopause among Brazilian women: results from a population-based survey." Cadernos de Saúde Pública. 2003;19(1):17–25.
- Loh FH, Khin LW, Saw SM, Lee JJ, Gu K. "The age of menopause and the menopause transition in a multiracial population: a nation-wide Singapore study." Maturitas. 2005;52(3–4):169–180.
- Park HA, Park JK, Park SA, Lee JS. "Age, menopause, and cardiovascular risk factors among Korean middle-aged women: the 2005 Korea National Health and Nutrition Examination Survey." Journal of Women's Health. 2010.
- Park CY, Lim JY, Park HY. "Age at natural menopause in Koreans: secular trends and influences thereon." Menopause. 2018;25(4):423–429.
- Dhillon HK, Singh HJ, Shuib R, Hamid AM, Mahmood NMZN. "Prevalence of menopausal symptoms in women in Kelantan, Malaysia." Maturitas. 2006.
- Okonofua FE, Lawal A, Bamgbose JK. "Features of menopause and menopausal age in Nigerian women." International Journal of Gynecology & Obstetrics. 1990;31(4):341–345.
- Kara IH, Aydin S, Gemalmaz A, et al. "Habitual tea drinking and bone mineral density in postmenopausal Turkish women (IPPOT Study)." International Journal for Vitamin and Nutrition Research. 2007;77(6).
- Pokoradi AJ, Iversen L, Hannaford PC. "Factors associated with age of onset and type of menopause in a cohort of UK women." American Journal of Obstetrics and Gynecology. 2011.
- Kontor O, Nyarko V, Botwe P. "Determinants of age at natural menopause among postmenopausal Ghanaian women in Okaikwei North District, Ghana." Innovation in Aging. 2024 (conference abstract).
- Hoàng Thị Ngọc Trâm, Hồ Cẩm Tú, Bùi Thị Hồng Thương. "Investigation of factors associated with age at menopause in postmenopausal women attending Thai Nguyen National Hospital." TNU Journal of Science and Technology. 2026;231(09):69–75. Data collected January–June 2025.
- Premasinghe KGDS, Punchihewa PHDN, Rajamanthri RDT, Rajapaksha RWVNA, Atapattu PM. "Association of lifestyle and reproductive factors with age at natural menopause among postmenopausal women in Gampaha District." Sri Lanka Journal of Menopause. 2025;6(1):11–21.
- Hidayet NM, Sharaf SA, Aref SR, Tawfik TA, Moubarak II. "Correlates of age at natural menopause: a community-based study in Alexandria." Eastern Mediterranean Health Journal. 1999;5(2):307–319.
- World Health Organization. "Menopause." Fact sheet, October 16, 2024.
- World Population Review. "Age of Menopause by Country 2026." 2026 edition; table and source list checked September 29, 2026.
- Kindr Health. "Median Age of Natural Menopause by Country." Version 1, updated July 13, 2026.
- Giudicessi JR, Noseworthy PA, Friedman PA, Ackerman MJ. "Urgent guidance for navigating and circumventing the QTc-prolonging and torsadogenic potential of possible pharmacotherapies for coronavirus disease 19 (COVID-19)." Mayo Clinic Proceedings. 2020.
- Gold EB, Bromberger J, Crawford S, et al. "Factors associated with age at natural menopause in a multiethnic sample of midlife women." American Journal of Epidemiology. 2001;153(9):865–874.
- Lewington S, Li L, Murugasen S, et al. "Temporal trends of main reproductive characteristics in ten urban and rural regions of China: the China Kadoorie Biobank study of 300 000 women." International Journal of Epidemiology. 2014;43(4):1252–1262.
- NHS. "Early or premature menopause." Reviewed March 11, 2025.
Related research
- Menopause Statistics 2026: symptom rates, age and duration figures, each traced to its source
- Menopause Racial Disparities 2026: what US studies show about group differences
- Research and Reference Library: every research page from The HRT Index
Dataset edition
Version 1.1 · Evidence checked September 29, 2026.
The HRT Index Research is an independent research and reference resource on women's midlife health, built from dated primary sources and transparent methods.