There is no single menopause statistic. The largest global synthesis of 19 separate menopause symptoms identified in this review — a 2024 meta-analysis of 321 studies covering 482,067 middle-aged women — reports pooled prevalence ranging from 20.50% to 65.43% depending on the symptom, and its authors rated the certainty of the evidence very low. Hot flashes, the symptom menopause is culturally synonymous with, came fifth at 52.65%.
The numbers do not just vary. Some contradict each other outright.
Two heavily repeated U.S. menopause statistics — 6,000 women reach menopause every day and 1.3 million women reach menopause every year — appear together on the current Society for Women’s Health Research menopause page. They also appear inside one clause on a Yale School of Medicine news page. They are not arithmetic equivalents. Six thousand a day is 2,190,000 a year. The gap is 890,000 women, or 68.5%.
This page gives the verified menopause statistics, the exact population each one describes, the original arithmetic behind the new findings, and — for the numbers that circulate hardest — where the citation chain actually ends.
Menopause statistics at a glance
| Statistic | Quote-safe finding | Source |
|---|---|---|
| Usual age worldwide | Most women experience natural menopause between ages 45 and 55 | World Health Organization |
| Usual age, United States | Menopause usually occurs around age 52 | CDC |
| U.S. women per year | More than 1 million U.S. women experience menopause each year | NIH Office of Research on Women’s Health |
| Highest pooled symptom estimate | Joint and muscular discomfort, 65.43% | Fang et al., 2024 meta-analysis |
| Hot flashes, pooled | 52.65% — fifth of 19 symptoms analyzed | Fang et al., 2024 meta-analysis |
| Frequent vasomotor-symptom duration | Median 7.4 years among women reporting frequent vasomotor symptoms — not among all women | SWAN / Avis et al., 2015 |
Source: WHO menopause fact sheet, CDC, NIH Office of Research on Women’s Health, Fang et al. 2024, and Avis et al. 2015. These figures describe different populations and are not interchangeable.
On this page: The headline findings · 19 symptom rates · By menopause stage · Hot flashes · Age · Annual U.S. count · Worldwide count · Duration · Work and treatment · Why numbers conflict · Methodology · Limitations · Citation record
What do the 2026 menopause statistics actually show?
The evidence supports precise figures for specific populations. It does not support one universal “menopause rate.” In the 2024 global synthesis, pooled estimates for 19 symptoms ranged from 20.50% to 65.43%, with seven of the 19 above 50% and fifteen above 40%. The estimates vary with the symptom, population, menopause stage, geography, study design, and measurement instrument; substantial heterogeneity remains unexplained.
A reader who sees “up to 80% experience vasomotor symptoms” on one page and “52.65% have hot flashes” on another may assume one must be wrong. They measure different outcomes. Vasomotor symptoms combine hot flashes and night sweats, “up to” is a ceiling rather than a central estimate, and the underlying populations and methods differ.
Five denominator corrections do most of the work:
| # | The shorthand | What is actually true |
|---|---|---|
| 1 | “80% of women have hot flashes” | Figures near 80% generally describe vasomotor symptoms — hot flashes and night sweats — and are often stated as “up to.” The 2024 pooled estimate for hot flashes specifically was 52.65%. |
| 2 | “Hot flashes last 7.4 years on average” | 7.4 years was a median among 1,449 SWAN participants who reported frequent vasomotor symptoms. It was not a mean and did not describe all women. |
| 3 | “26% of women worldwide are menopausal” | WHO’s 26% describes women and girls aged 50 and older in 2021. Age is not menopause status. |
| 4 | “5% of menopausal women get treatment” | The 5% denominator was all U.S. women ages 45–64, not all women in menopause. |
| 5 | “Menopause costs the U.S. $1.8 billion a year” | That figure is an extrapolation of lost work time from one employee survey. It is not a total economic cost. |
Source: The HRT Index Editorial Team, from the original sources cited throughout this page. Last verified August 1, 2026.
What percentage of women experience each menopause symptom?
A 2024 systematic review and meta-analysis pooled 321 studies covering 482,067 middle-aged women and reported prevalence estimates for 19 symptoms. Joint and muscular discomfort was highest at 65.43%; formication was lowest at 20.50%. The authors rated the certainty of the pooled evidence very low because the underlying studies differed substantially in population, instrument, and design.
We read the full paper and reproduced every derived figure below from its published point estimates and confidence intervals.
The 19 symptoms, ranked
| Rank | Symptom | Pooled prevalence | 95% confidence interval |
|---|---|---|---|
| 1 | Joint and muscular discomfort | 65.43% | 62.51%–68.29% |
| 2 | Physical and mental exhaustion | 64.13% | 60.93%–67.27% |
| 3 | Poor memory | 54.44% | 48.87%–59.95% |
| 4 | Irritability | 54.37% | 50.80%–57.92% |
| 5 | Hot flashes | 52.65% | 50.24%–55.06% |
| 6 | Sleep problems | 51.89% | 49.55%–54.22% |
| 7 | Anxiety | 50.53% | 46.65%–54.40% |
| 8 | Mood swings | 49.03% | 43.65%–54.43% |
| 9 | Changes in skin appearance, texture, or tone | 46.48% | 36.21%–56.89% |
| 10 | Drying skin | 46.03% | 38.81%–53.34% |
| 11 | Sexual problems | 45.45% | 41.89%–49.04% |
| 12 | Difficulty concentrating | 44.85% | 37.71%–52.09% |
| 13 | Headaches | 43.91% | 40.64%–47.21% |
| 14 | Depression | 43.34% | 40.29%–46.42% |
| 15 | Heart discomfort | 42.12% | 38.85%–45.42% |
| 16 | Vaginal dryness | 37.34% | 34.30%–40.44% |
| 17 | Urinary problems | 34.49% | 31.70%–37.34% |
| 18 | Increased facial hair | 27.19% | 21.09%–33.74% |
| 19 | Formication | 20.50% | 13.44%–28.60% |
Source: Fang Y, Liu F, Zhang X, et al. “Mapping global prevalence of menopausal symptoms among middle-aged women: a systematic review and meta-analysis.” BMC Public Health. 2024;24:1767. Estimates are pooled across highly heterogeneous studies and are not universal rates. The paper reports I² above 98% for all 19 pooled symptom estimates and rates the evidence certainty very low.
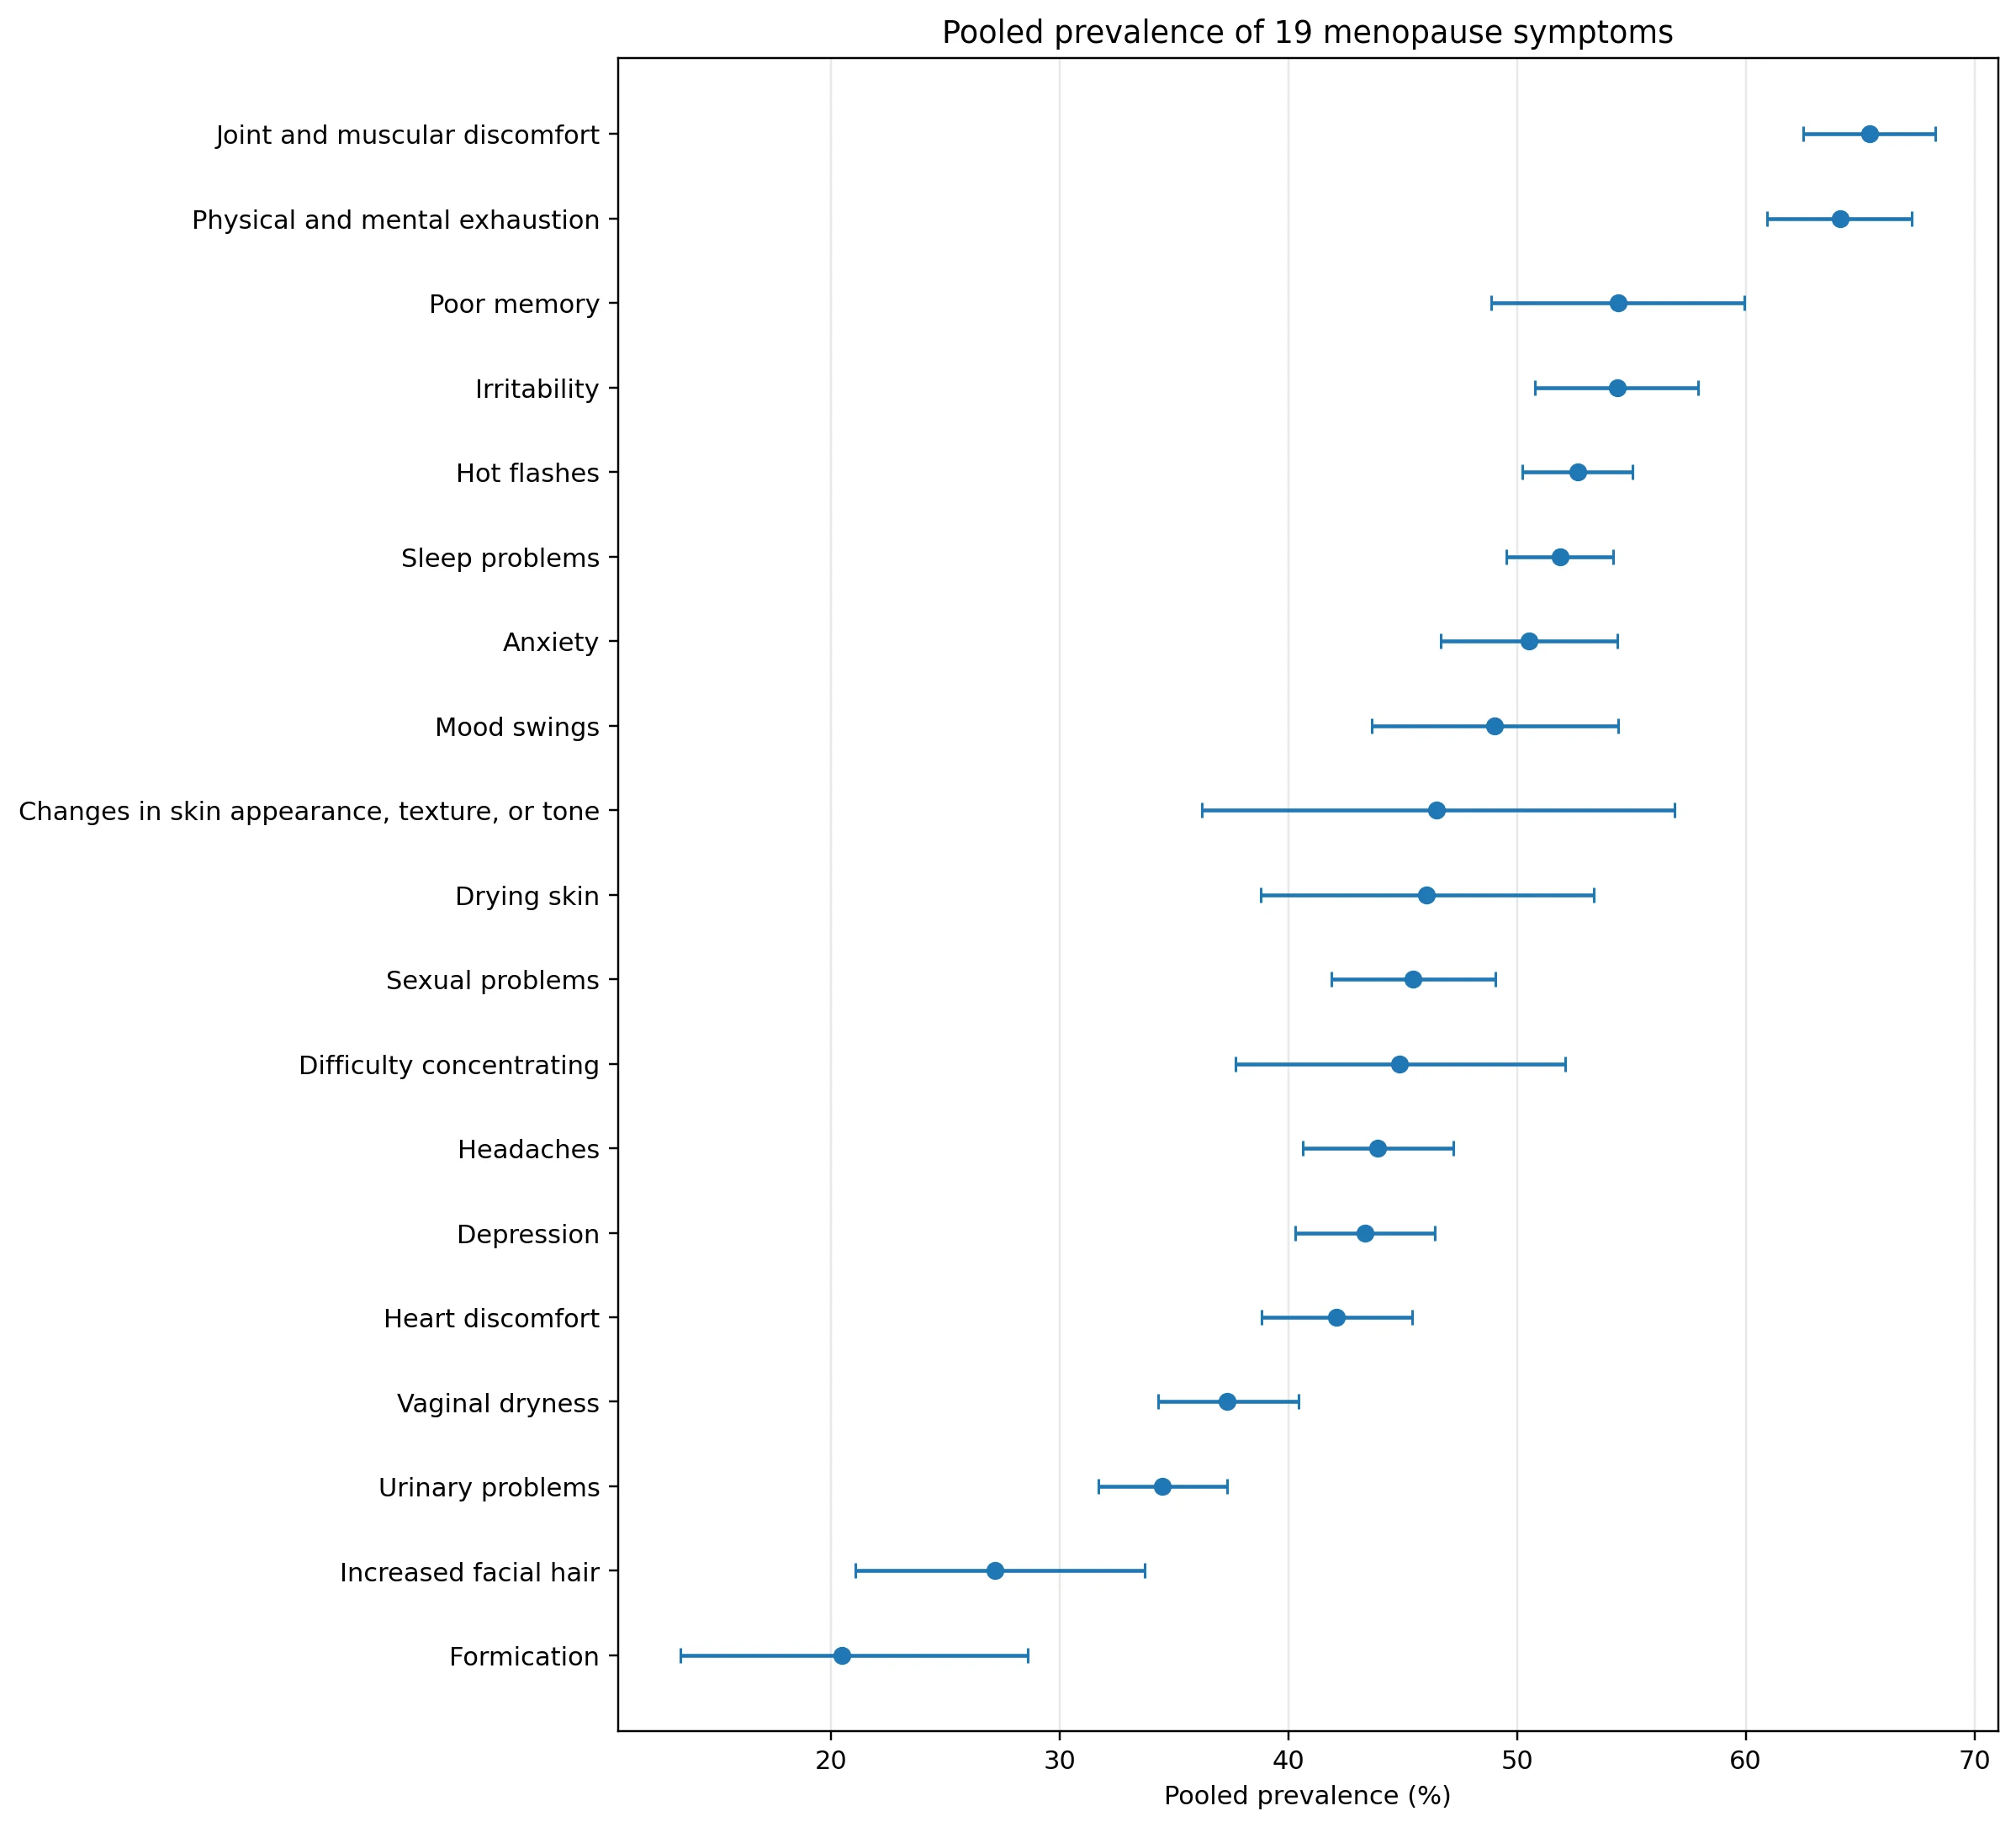
Figure 1. Pooled symptom estimates and 95% confidence intervals from Fang et al. 2024. Visualization produced by The HRT Index Editorial Team; data version 1.0, verified August 1, 2026.
What we calculated from the 19 estimates
The following are arithmetic summaries of the 19 published point estimates. They describe the distribution of 19 symptom-level estimates, not the share of women who experience at least one symptom and not change within individual women over time.
| Derived finding | Result | How to reproduce it |
|---|---|---|
| Estimates above 50% | 7 of 19 | Count point estimates greater than 50.00 |
| Estimates above 40% | 15 of 19 | Count point estimates greater than 40.00 |
| Median of the 19 estimates | 46.03% | Median of the 19 point estimates |
| Unweighted mean of the 19 estimates | 46.01% | Sum of the 19 point estimates ÷ 19 |
| Highest-to-lowest spread | 44.93 percentage points | 65.43 − 20.50 |
| Rank of hot flashes | 5th of 19 | Sort the 19 point estimates from highest to lowest |
| Widest reported confidence interval | 20.68 points — skin appearance | 56.89 − 36.21 |
| Narrowest reported confidence interval | 4.67 points — sleep problems | 54.22 − 49.55 |
Source: The HRT Index Editorial Team, calculated from the point estimates and confidence intervals published by Fang et al. 2024. Verified August 1, 2026.
Three things stand out.
Hot flashes rank fifth. Four symptoms had higher pooled point estimates: joint and muscular discomfort, physical and mental exhaustion, poor memory, and irritability. In this synthesis, the symptom most closely associated with menopause in public discussion was not the highest-ranked symptom.
The unweighted mean and median of the 19 point estimates are nearly identical: 46.01% and 46.03%. That is a descriptive fact about this 19-number set. It does not establish that the underlying study data are normally distributed, symmetric, or free from influential outliers.
The reported confidence-interval widths vary more than fourfold. The interval for changes in skin appearance is 20.68 percentage points wide; the interval for sleep problems is 4.67 points wide. Those are model-reported intervals around pooled estimates. A narrower interval does not erase the extreme between-study heterogeneity.
A source-consistency note
The paper’s abstract and discussion report the joint-and-muscular-discomfort interval as 62.51%–68.29%. One passage in the results body prints 65.51%–68.29%. We use 62.51%–68.29% because that value appears in both the abstract and discussion and is internally compatible with the 65.43% point estimate. The inconsistency is preserved here rather than silently ignored.
How do menopause symptom statistics differ by stage?
The same meta-analysis reported stage-specific pooled estimates for five symptoms, and all five postmenopause estimates were higher than the corresponding premenopause estimates. Hot flashes differed by 25.43 percentage points between the pooled premenopause and postmenopause estimates; vaginal dryness differed by 23.65 points. These are comparisons across pooled study groups, not a record of the same women moving through the transition.
| Symptom | Premenopause | Perimenopause | Postmenopause | Post minus pre |
|---|---|---|---|---|
| Hot flashes | 31.31% | 56.52% | 56.74% | +25.43 points |
| Vaginal dryness | 21.16% | 36.07% | 44.81% | +23.65 points |
| Sexual problems | 35.24% | 48.82% | 53.97% | +18.73 points |
| Urinary problems | 22.21% | 33.29% | 40.27% | +18.06 points |
| Depression | 36.27% | 47.30% | 47.62% | +11.35 points |
Source: Fang et al. 2024. Final column calculated by The HRT Index Editorial Team. Stage definitions and instruments varied across the included studies.
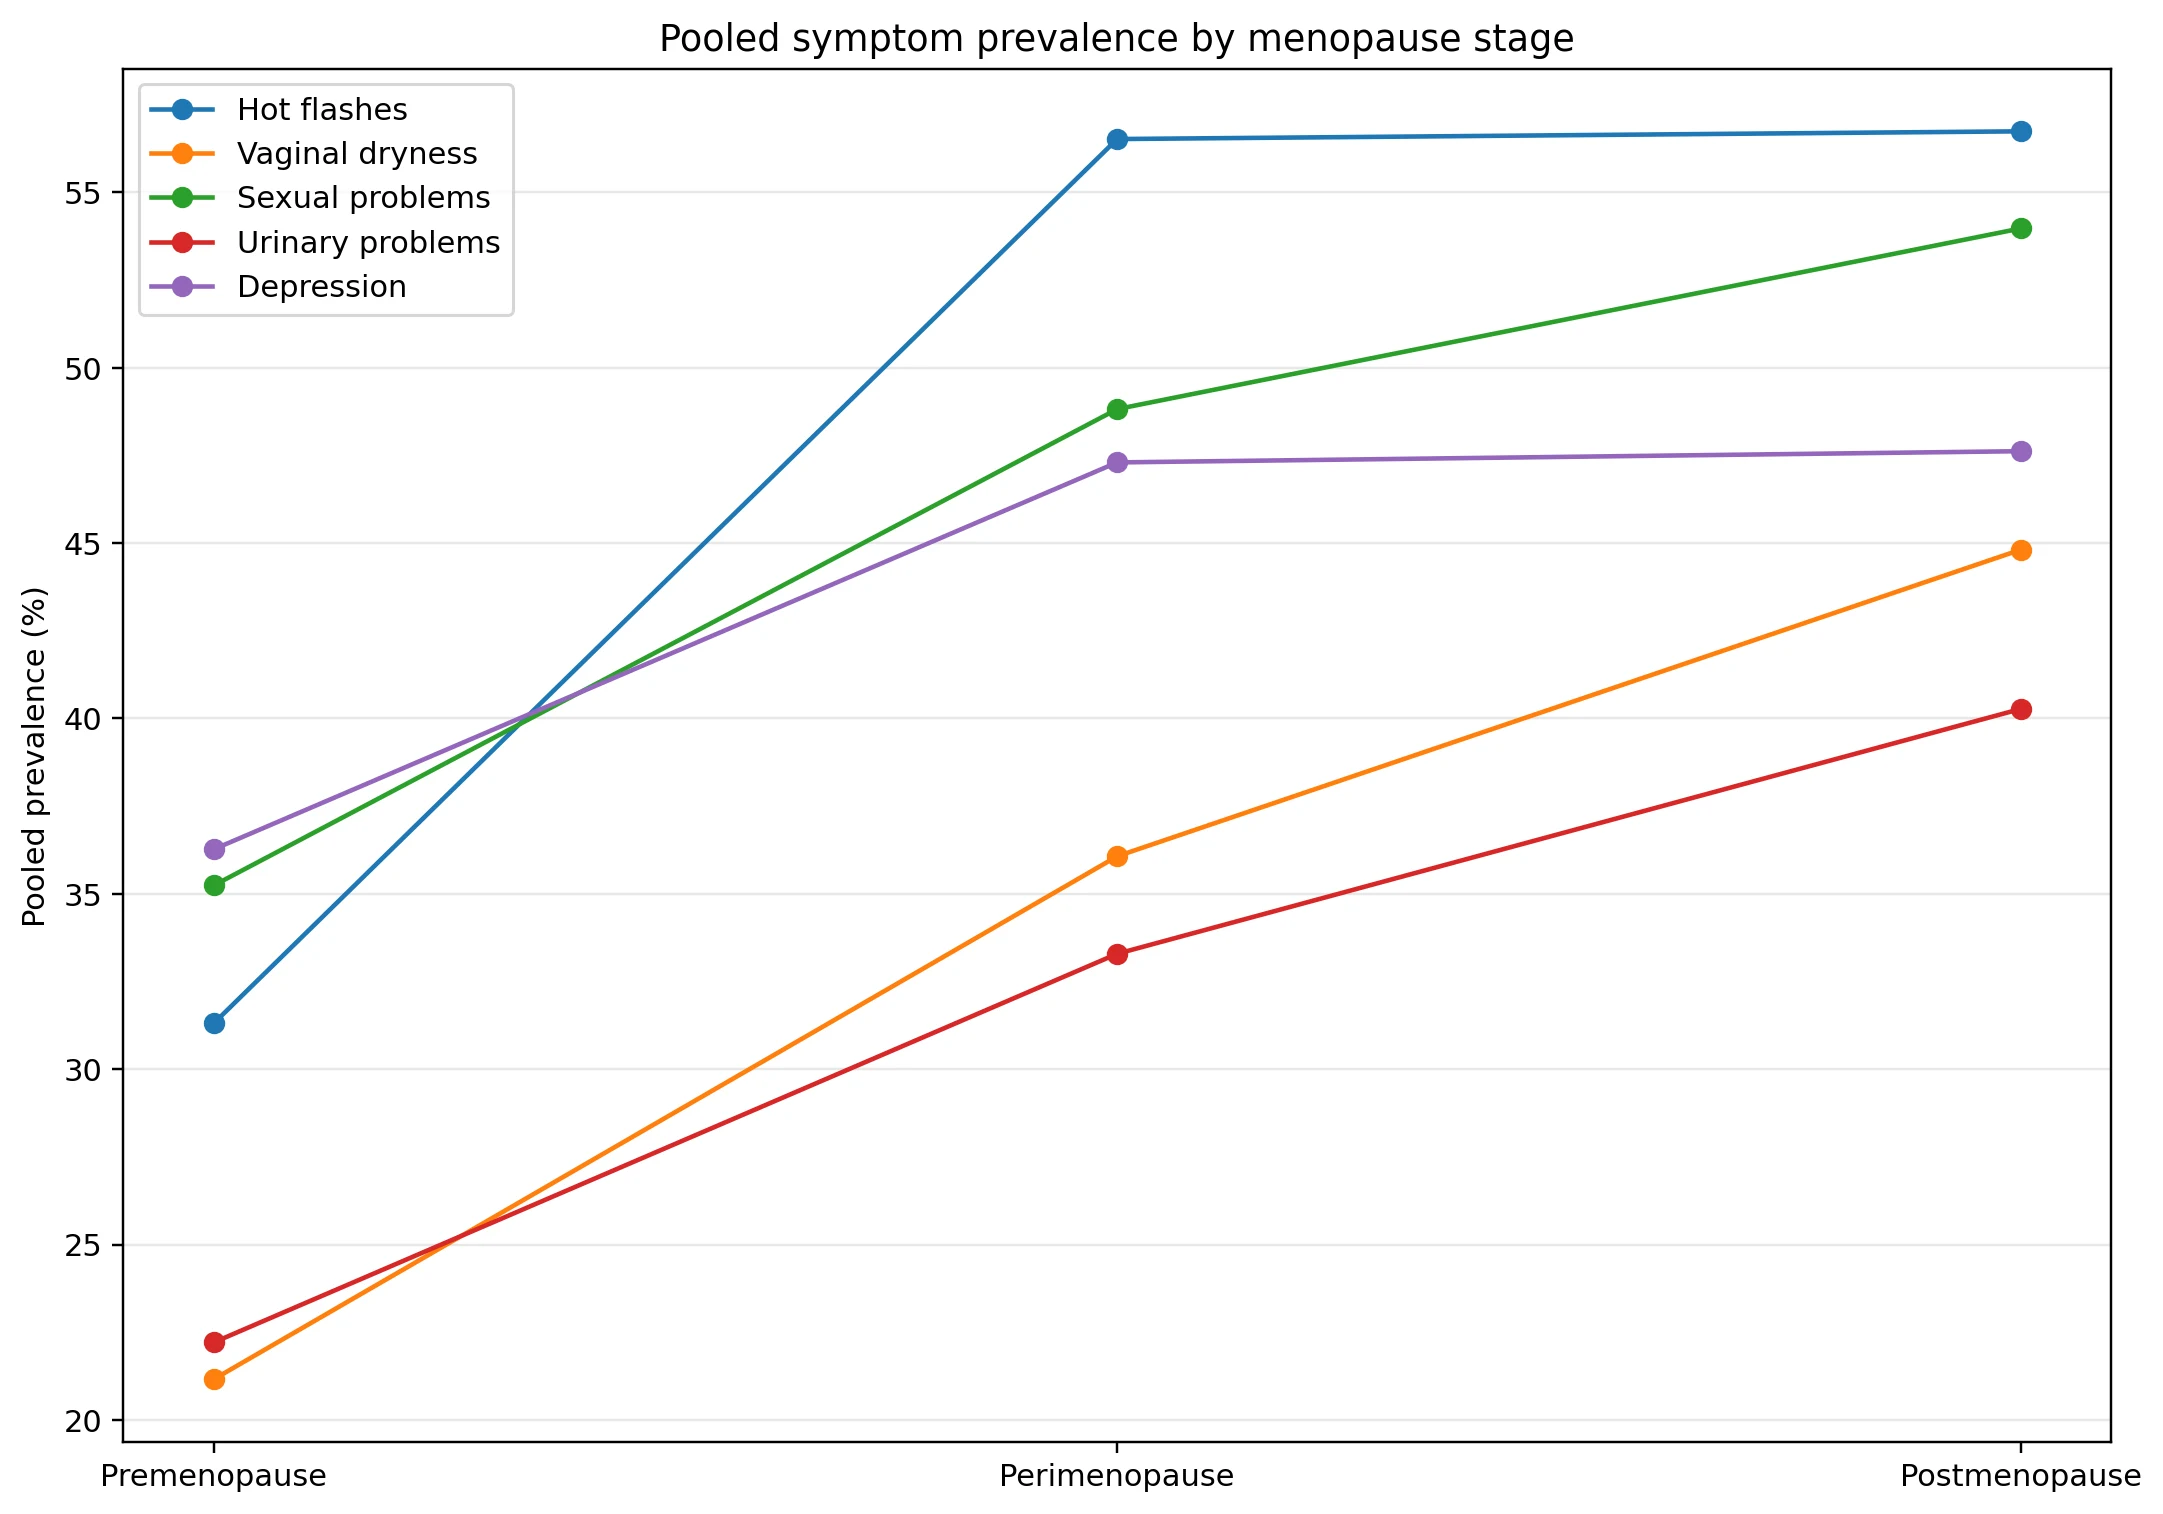
Figure 2. Stage-specific pooled estimates from Fang et al. 2024. Visualization produced by The HRT Index Editorial Team; data version 1.0, verified August 1, 2026.
Where the pooled pre-to-post difference sits
We split each pooled premenopause-to-postmenopause difference into two arithmetic pieces: premenopause to perimenopause, and perimenopause to postmenopause.
| Symptom | Pre → peri | Peri → post | Pre → peri share of the full pre → post difference |
|---|---|---|---|
| Hot flashes | +25.21 points | +0.22 points | 99.1% |
| Depression | +11.03 points | +0.32 points | 97.2% |
| Sexual problems | +13.58 points | +5.15 points | 72.5% |
| Vaginal dryness | +14.91 points | +8.74 points | 63.0% |
| Urinary problems | +11.08 points | +6.98 points | 61.4% |
Source: The HRT Index Editorial Team, calculated from the stage-specific pooled estimates in Fang et al. 2024. Formula: (perimenopause estimate − premenopause estimate) ÷ (postmenopause estimate − premenopause estimate). Verified August 1, 2026.
In these pooled estimates, almost all of the observed pre-to-post difference for hot flashes and depression sits between the premenopause and perimenopause estimates. A larger share of the pooled difference for vaginal dryness and urinary problems sits between the perimenopause and postmenopause estimates.
What this shows: two different numerical shapes inside the pooled stage table.
What this does not show: symptom onset, symptom progression, a plateau, or the course of symptoms within an individual woman. The estimates come from different pooled study groups. The step decomposition is arithmetic, not a longitudinal finding.
What percentage of women have hot flashes?
The 2024 meta-analysis estimated pooled hot-flash prevalence at 52.65% among middle-aged women. Its stage-specific estimates were 31.31% in premenopause, 56.52% in perimenopause, and 56.74% in postmenopause. Higher figures often refer to the broader category of vasomotor symptoms, which includes hot flashes and night sweats.
| Measure | Finding | What the denominator means |
|---|---|---|
| Hot flashes, pooled | 52.65% | Middle-aged women represented in 265 included hot-flash studies; pooled across varying populations and instruments |
| Hot flashes, premenopause | 31.31% | Pooled premenopause study groups |
| Hot flashes, perimenopause | 56.52% | Pooled perimenopause study groups |
| Hot flashes, postmenopause | 56.74% | Pooled postmenopause study groups |
| Vasomotor symptoms, NIH summary | Up to 80% | Broader category including hot flashes and night sweats; stated as an upper-bound summary |
Source: Fang et al. 2024 and the NIH Office of Research on Women’s Health fact sheet. “Hot flashes” and “vasomotor symptoms” are not interchangeable labels.
The quote-safe wording is:
A 2024 meta-analysis estimated pooled hot-flash prevalence at 52.65% among middle-aged women, while NIH states that up to 80% experience the broader category of vasomotor symptoms.
What is the average age of menopause?
Most women experience natural menopause between ages 45 and 55 worldwide. U.S. sources commonly summarize the central age as 51 or 52. WHO gives a global range, NIH reports an average age of 51, CDC says menopause usually occurs around 52, and SWAN reported a median natural final-menstrual-period age of 52.54 in its observed cohort.
| Figure | What it actually is | Source |
|---|---|---|
| 45–55 | Range in which natural menopause generally occurs worldwide | WHO menopause fact sheet, October 16, 2024 |
| 51 | Average age stated in the NIH women’s-health fact sheet | NIH Office of Research on Women’s Health |
| Around 52 | Usual U.S. age stated as an approximation | CDC, November 14, 2024 |
| 52.54 | Median age at natural final menstrual period among 1,483 SWAN participants with an observed natural FMP | Gold et al., 2013 |
Source: WHO, NIH ORWH, CDC, and Gold et al. 2013.
The safe formulation: most women experience natural menopause between ages 45 and 55, and U.S. sources place the central age at about 51 to 52.
The one- to two-year spread among these figures is not an arithmetic contradiction. It reflects a worldwide range, rounded U.S. summaries, and one cohort-specific median. None is an exact age that applies to an individual.
Final menstrual period (FMP) is the last menstrual bleed. Natural menopause is recognized retrospectively after 12 consecutive months without menstruation when no other physiological or pathological cause explains the absence and no clinical intervention caused it.
How many women reach menopause each year?
The safest official U.S. formulation located in this audit is the NIH’s: more than 1 million U.S. women experience menopause each year. More precise-looking numbers circulate widely, but the two most common exact formulations do not agree with each other.
The contradiction in plain arithmetic
| Published formulation | Annual or daily equivalent |
|---|---|
| 6,000 women per day | 2,190,000 per year |
| 1.3 million women per year | 3,562 per day |
| Difference | 890,000 per year or 2,438 per day |
| Relative difference | The 6,000-per-day figure implies an annual count 68.5% higher than 1.3 million |
Source: The HRT Index Editorial Team; see the primary sources linked in this section.
The current Society for Women’s Health Research menopause page states both 6,000 per day and 1.3 million per year. Yale School of Medicine placed the two values in the same sentence in April 2025. They cannot be arithmetic equivalents.
Where the source chains lead
| Figure | Publication chain checked | What the chain establishes |
|---|---|---|
| More than 1 million per year | NIH Office of Research on Women’s Health | Current official broad statement; no false precision |
| 6,000 per day | SWHR → Whiteley et al. 2013 | Whiteley repeats the number in its introduction. The study itself analyzed quality of life and economic burden in a 2005 survey; it did not produce a national menopause-incidence estimate. |
| 1.3 million per year | SWHR 2025 fact sheet → 2024 StatPearls | The fact sheet cites StatPearls as its reference. |
| 1.3 million per year | Current StatPearls → Crandall et al., JAMA 2023 review | Current StatPearls repeats the figure and cites the review. The figure is not present in the review’s publicly accessible abstract; this audit did not resolve the chain to an original national incidence calculation. |
| Both values together | Yale School of Medicine, April 14, 2025 | The page links 6,000 per day to Whiteley and 1.3 million per year to a JAMA Health Forum paper. That JAMA paper cites the 2024 StatPearls chapter for the annual count. |
Source: NIH ORWH, SWHR menopause page, Whiteley et al. 2013, SWHR 2025 fact sheet, StatPearls, Crandall et al. 2023, Yale School of Medicine, and Yang and Toriola 2024.
What we are not doing
We are not publishing our own annual U.S. menopause-incidence estimate.
A population projection could be built from single-year-of-age counts and an assumed distribution of final-menstrual-period ages. The result would depend on the population base, the menopause definition, surgical menopause, mortality, migration, and the shape assigned to the age distribution. Those assumptions would be stripped away the first time the number was quoted.
Use the NIH wording instead: more than 1 million U.S. women experience menopause each year. It is official, current within the audited source set, and honest about its precision.
How many women worldwide are postmenopausal?
The audited sources do not provide a current observed global count based on directly measured menopause status. WHO reports an age-based demographic fact instead: in 2021, women aged 50 and older represented 26% of all women and girls globally, up from 22% ten years earlier. Age 50 and older is not the same as confirmed menopause.
| Figure | What it is | What it is not |
|---|---|---|
| Women aged 50+ were 26% of women and girls globally in 2021 | A current WHO age-based demographic fact | A measured percentage of women who were menopausal |
| A woman aged 60 in 2019 could expect to live another 21 years on average | A WHO global longevity statistic | A menopause-duration statistic |
| 1.2 billion by 2030, with 47 million new entrants annually | A projection published by Kenneth Hill in 1996 using age 50 as a proxy for menopause | A current observed count or direct menopause-status census |
Source: WHO menopause fact sheet and Kenneth Hill, “The demography of menopause,” Maturitas, 1996.
The widely repeated 1.2 billion by 2030 figure is traceable. It is not a mystery statistic. It comes from a 1996 demographic model that used age 50 as a proxy for menopause, estimated 467 million postmenopausal women in 1990, and projected 1.2 billion menopausal and postmenopausal women by 2030.
That makes it a historical projection with a stated proxy and model year. It should not be described as a current observed count, and it should not be attributed to WHO unless a WHO source actually presents it.
How long do hot flashes and night sweats last?
Among 1,449 SWAN participants who reported frequent vasomotor symptoms, the median total duration was 7.4 years. Among 881 participants with an observable final menstrual period, frequent symptoms continued for a median of 4.5 years after that period. “Frequent” meant hot flashes or night sweats on at least six days during the previous two weeks.
| SWAN finding | Median duration | Exact scope |
|---|---|---|
| Total frequent-VMS duration | 7.4 years | 1,449 participants who reported frequent VMS |
| Persistence after the final menstrual period | 4.5 years | 881 frequent-VMS participants with an observable FMP |
| Symptoms first reported in premenopause or early perimenopause | More than 11.8 years total | Early-onset frequent-VMS group |
| Persistence after FMP in that early-onset group | 9.4 years | Early-onset frequent-VMS group |
| Symptoms first reported in postmenopause | 3.4 years total | Postmenopausal-onset frequent-VMS group |
Source: Avis NE, Crawford SL, Greendale G, et al. “Duration of menopausal vasomotor symptoms over the menopause transition.” JAMA Internal Medicine. 2015;175(4):531–539.
The 7.4-year figure is often shortened into “hot flashes last 7.4 years on average.” That changes three parts of the claim:
- It changes a median into an average.
- It drops the frequent-VMS eligibility criterion.
- It changes a defined study subgroup into all women.
SWAN used annual assessments and a two-week symptom-recall window, and some participants were still symptomatic at their last observation. The authors wrote that total duration could therefore have been underestimated.
How common are early menopause and primary ovarian insufficiency?
The current international guideline defines primary ovarian insufficiency as loss of ovarian activity before age 40 and early menopause as cessation of ovarian function from age 40 through 44. It reports that the prevalence of non-iatrogenic POI ranges from approximately 1% in older studies to 3.5% in newer publications.
| Category | Definition | Evidence-supported prevalence statement |
|---|---|---|
| Primary ovarian insufficiency | Loss of ovarian activity before age 40, characterized by irregular or absent cycles with elevated gonadotropins and low estradiol | Approximately 1% to 3.5% for non-iatrogenic POI, depending on study era and population |
| Early menopause | Cessation of ovarian function at ages 40–44 | The guideline defines the age band but does not supply one universal prevalence estimate in its headline recommendation |
Source: Panay N, Anderson RA, Bennie A, et al., on behalf of the ESHRE, ASRM, CREWHIRL, and IMS Guideline Group on POI. “Evidence-based guideline: premature ovarian insufficiency.” Human Reproduction Open. 2024;2024(4):hoae065.
Iatrogenic means caused by medical treatment. The 1%–3.5% range is for non-iatrogenic POI and should not be expanded to include ovarian insufficiency following chemotherapy, radiation, or surgery without a source that does so.
A prevalence statistic cannot diagnose POI. The guideline recommends that clinicians consider and exclude POI in women younger than 40 who have amenorrhea, irregular cycles, or symptoms of estrogen deficiency.
What do menopause statistics show about work, treatment, and group differences?
Three heavily quoted menopause statistics come from narrow, specific denominators that disappear when the numbers are shortened. A Mayo Clinic survey found that 13.4% of employed respondents reported an adverse work outcome. An AARP/NORC analysis estimated that 5% of all U.S. women ages 45–64 were treated for menopause. SWAN reported different unadjusted durations of frequent vasomotor symptoms across its five racial and ethnic study groups.
Work
| Finding | Estimate | Actual denominator |
|---|---|---|
| At least one adverse work outcome attributed to menopause symptoms | 13.4% — 597 respondents | 4,440 employed respondents at four Mayo Clinic sites |
| Missed work in the prior 12 months | 10.8% — 480 respondents | Same 4,440 respondents |
| Median missed work | 3 days | Respondents who reported missed work |
| Odds of an adverse work outcome, highest versus lowest symptom-severity quartile | 15.6 times | Adjusted association within the survey sample |
| Estimated annual U.S. loss from missed work time | $1.8 billion | National extrapolation from survey-reported missed days; not an administrative total |
Source: Faubion SS, Enders F, Hedges MS, et al. “Impact of Menopause Symptoms on Women in the Workplace.” Mayo Clinic Proceedings. 2023;98(6):833–845. The study sent 32,469 invitations, received 5,219 responses — a 16.1% response rate — and analyzed 4,440 employed respondents. The analytic sample was 93.0% White.
The quote-safe formulation is:
A 2023 Mayo Clinic study extrapolated approximately $1.8 billion in annual U.S. lost work time associated with menopause symptoms. The estimate came from a cross-sectional employee survey and does not represent the total economic cost of menopause.
A full reconciliation of workplace-cost models is available in Menopause Workplace Cost: 2026 U.S. Data.
Treatment
| Finding | Estimate | Actual denominator |
|---|---|---|
| Women treated for menopause | 2.1 million | Average annual U.S. estimate for women ages 45–64, using pooled 2016–2021 MEPS data and interpreted by the authors as a 2021 estimate |
| Treated prevalence | 5.0% | All U.S. women ages 45–64 |
| Estimated share treated among women in menopause | 20%–25% | Report-derived menopause denominator |
| Treated prevalence, Hispanic women | 2.7% | U.S. women ages 45–64 in that group |
| Treated prevalence, non-Hispanic Black women | 2.5% | U.S. women ages 45–64 in that group |
| Treated prevalence, non-Hispanic White women | 6.3% | U.S. women ages 45–64 in that group |
| HRT prescription among treated women ages 57–64 | 76.3% | Treated women in that age group |
| HRT prescription among treated women ages 45–56 | 56.1% | Treated women in that age group |
Source: AARP Public Policy Institute and NORC, “Women in Menopause Often Go Untreated,” published April 17, 2025. The analysis pooled 2016–2021 Medical Expenditure Panel Survey data to obtain an adequate sample and generalized to the average annual population across those years.
This is treated prevalence, not symptom prevalence and not diagnosis prevalence. Menopause appeared in the analysis when linked to a reported medical event, so untreated or unrecorded menopause does not enter the treated count.
A different nationally representative analysis found current prescription menopausal hormone therapy use of 4.7% among U.S. postmenopausal women in the 2017–March 2020 NHANES cycle, down from 26.9% in 1999–2000. That is a prescription-use measure in a postmenopausal population, not the same statistic as AARP’s 5% treated prevalence among all women ages 45–64. The complete denominator-by-denominator reconciliation is in How Many Women Use HRT? 2026 Statistics.
Source: Yang L, Toriola AT. “Menopausal Hormone Therapy Use Among Postmenopausal Women.” JAMA Health Forum. 2024;5(9):e243128.
Differences between racial and ethnic study groups
SWAN reported the following unadjusted median total durations among participants who experienced frequent vasomotor symptoms:
| SWAN study group | Median total duration of frequent VMS |
|---|---|
| African American | 10.1 years |
| Hispanic | 8.9 years |
| Non-Hispanic White | 6.5 years |
| Chinese | 5.4 years |
| Japanese | 4.8 years |
Source: Avis et al. 2015. These are unadjusted descriptive medians within the frequent-VMS sample.
These numbers describe differences observed inside one cohort. They do not identify the cause, prove fixed biological differences, or predict an individual’s duration. Social conditions, health, stress, access to care, measurement, cohort composition, and other factors can affect observed differences. The broader evidence map is in Menopause Racial Disparities 2026.
Why do menopause statistics conflict?
Menopause statistics conflict because sources count different symptoms, stages, populations, thresholds, outcomes, and time windows — and because some repeated figures never resolve to an original calculation. A number can be accurate inside its study and become misleading when its denominator or design is removed.
Six ways a menopause statistic goes wrong
- Hot flashes versus vasomotor symptoms. VMS combines hot flashes and night sweats. A figure for VMS cannot automatically be relabeled as a hot-flash rate.
- Mean versus median. SWAN reported a median. Replacing it with “average” changes the statistic.
- Symptoms versus treatment. Symptom prevalence and treated prevalence answer different questions.
- Age versus menopause status. Women aged 50 and older are a demographic group, not a measured menopause-status group.
- Observed versus extrapolated. A survey count and a national dollar model are different objects.
- Cross-sectional versus longitudinal. Pooled stage comparisons do not trace individual progression.
Where three widely circulated figures end
| Figure | Where the chain leads | Status |
|---|---|---|
| 6,000 U.S. women reach menopause daily | Repeated by SWHR and Whiteley et al.; Whiteley’s study did not calculate national menopause incidence | Repeated estimate without an original incidence method established in this audit |
| 1.3 million U.S. women per year | SWHR fact sheet → StatPearls → JAMA narrative review; the number is absent from the review’s public abstract | Chain not resolved to an original national incidence calculation |
| 1.2 billion menopausal or postmenopausal women by 2030 | Kenneth Hill’s 1996 demographic model using age 50 as a proxy | Traceable historical projection, not a current observed count |
Source: The HRT Index Editorial Team. Chains traced and recorded August 1, 2026 from the linked publisher and original-source pages.
Two publishers place incompatible annual figures together
| Source | Published wording | Arithmetic problem |
|---|---|---|
| Society for Women’s Health Research | Current page states approximately 6,000 per day and 1.3 million per year | 6,000 × 365 = 2.19 million, not 1.3 million |
| Yale School of Medicine | April 2025 page says approximately 6,000 per day “or” 1.3 million annually | The figures differ by 890,000 per year |
Source: The HRT Index Editorial Team; see the primary sources linked in this section.
We are reporting the discrepancy, not inventing a reason for it.
The claim audit: what not to publish
| Common shorthand | Why it is unsafe | Publishable replacement |
|---|---|---|
| “80% of women have hot flashes” | Conflates hot flashes with the broader VMS category and often drops “up to” | “The 2024 pooled estimate for hot flashes among middle-aged women was 52.65%; NIH states that up to 80% experience vasomotor symptoms.” |
| “The average woman has hot flashes for 7.4 years” | Median, not mean; frequent-VMS subgroup, not all women | “Among 1,449 SWAN participants reporting frequent vasomotor symptoms, the median total duration was 7.4 years.” |
| “Exactly 1.3 million U.S. women enter menopause each year” | The source chain did not resolve to an original current national incidence calculation, and 6,000-per-day claims conflict with it | “NIH states that more than 1 million U.S. women experience menopause each year.” |
| “26% of women worldwide are menopausal” | WHO’s figure describes age, not menopause status | “In 2021, women aged 50 and older represented 26% of women and girls worldwide.” |
| “Menopause costs the U.S. $1.8 billion annually” | Measures extrapolated lost work time only | “A 2023 Mayo Clinic study extrapolated approximately $1.8 billion in annual U.S. lost work time associated with menopause symptoms.” |
| “Only 5% of menopausal women receive treatment” | The 5% denominator is all U.S. women ages 45–64 | “An analysis estimated that 5% of U.S. women ages 45–64 were treated for menopause, representing roughly 20%–25% of women in menopause.” |
| “POI affects exactly 1% of women” | The current guideline reports a wider range | “The international guideline reports non-iatrogenic POI estimates from approximately 1% to 3.5%.” |
| “Joint pain is the most common menopause symptom” | It was the highest pooled estimate in one very-low-certainty synthesis | “Joint and muscular discomfort had the highest pooled estimate among the 19 symptoms analyzed in the 2024 meta-analysis.” |
| “There are currently 1.2 billion menopausal women” | The source is a 1996 projection to 2030 using age 50 as a proxy | “A 1996 demographic model projected 1.2 billion menopausal and postmenopausal women by 2030 using age 50 as a proxy.” |
Source: The HRT Index Editorial Team, from the original sources cited throughout this page. Verified August 1, 2026.
How we produced this
We built this page by opening each source and recording what it actually measured, rather than collecting figures from other statistics pages. For every statistic in the evidence ledger, we recorded the population, denominator, geography, menopause stage, point estimate, confidence interval when reported, study design, data period, material limitation, source, and verification date.
What we did
- We read the original sources. The 2024 meta-analysis, WHO fact sheet, NIH fact sheet, CDC page, SWAN studies, POI guideline, workplace study, treatment analysis, and demographic projection were checked directly.
- We reproduced the arithmetic. Every derived figure — counts above 50% and 40%, the median and mean of the 19 estimates, confidence-interval widths, stage-step decomposition, and day-to-year conversions — was recomputed from displayed source values.
- We followed citations backward. Where one publication attributed a number to another, we opened the cited source and continued until the chain ended or could no longer be resolved to an original calculation.
- We separated source findings from our calculations. Every derived result is labeled as a calculation by The HRT Index Editorial Team.
- We preserved conflicting source values instead of averaging them. Averages across unlike denominators would create a number that measures nothing.
What we did not do
- We did not combine unlike populations to manufacture a new overall symptom prevalence.
- We did not estimate the percentage who experience “any menopause symptom” from symptom-specific pooled rates.
- We did not convert age 50 and older into menopause status.
- We did not publish our own annual U.S. menopause-incidence count.
- We did not claim that cross-sectional stage differences show individual symptom progression.
- We did not speculate about why publishers repeated incompatible figures.
Research independence
This report contains no affiliate links, provider recommendations, lead routing, sponsored placement, or commercial promotions. It was produced independently of The HRT Index’s provider-comparison content. No source, health system, publisher, professional organization, or funder reviewed, funded, or influenced the analysis.
Inclusion rules
A statistic appears in the published ledger only when:
- The measured population and denominator can be identified.
- The original or issuing source can be opened.
- The publication date and data period are known or the source clearly states that they are unavailable.
- The estimate can be tied to a defined outcome.
- A material limitation can be stated plainly.
- The safe wording remains accurate when quoted by itself.
Exclusion rules
We excluded or demoted:
- Statistics whose chain never resolved beyond another roundup or tertiary summary.
- Vendor survey findings presented as national prevalence.
- Projections presented as observed current counts.
- Figures that equate an age band with menopause status.
- Estimates without a recoverable denominator.
- Any derived number whose assumptions would disappear when quoted.
Normalization rules
- Preserve mean and median exactly as reported.
- Keep hot flashes separate from combined vasomotor symptoms unless the source combines them.
- Keep symptom prevalence, diagnosis, treatment, prescription use, and work outcomes separate.
- Preserve geography, menopause stage, and study population.
- Express subtraction between percentages in percentage points.
- Label observed, pooled, adjusted, modeled, extrapolated, and derived values distinctly.
- Do not interpret pooled stage comparisons as individual trajectories.
- Use the source population’s terminology and state the resulting limitation.
Data files and data dictionary
The evidence ledger is available in machine-readable form:
Each row contains these fields:
| Field | Meaning |
|---|---|
record_id | Stable row identifier |
topic | Symptom prevalence, stage, age, duration, annual count, demography, work, treatment, or POI |
metric | What the row measures |
estimate and unit | Source-reported or derived value and unit |
lowerci and upperci | Confidence bounds when reported |
studycount and samplesize | Number of studies or participants when reported and applicable |
population | Exact study or agency population |
denominator | The population used for the rate or count |
geography | Worldwide, United States, or study-specific geography |
menopause_stage | Premenopause, perimenopause, postmenopause, mixed, or not applicable |
study_design | Official fact, meta-analysis, cohort, cross-sectional survey, survey-data analysis, projection, or derived arithmetic |
value_type | Pooled estimate, observed value, modeled estimate, projection, or original calculation |
calculation | Reproduction formula for derived rows |
data_period | Years represented by the data |
sourcetitle, sourcepublisher, sourceyear, sourceurl | Original source record |
material_limitation | The caveat required for accurate use |
safe_quote | Complete wording that remains accurate in isolation |
common_misquote | A claim the row does not support |
verified_on | Claim-level verification date |
dataset_version | Evidence-ledger release |
publish_status | Publish, qualified, historical, or excluded |
Source: The HRT Index Editorial Team; see the primary sources linked in this section.
How to reproduce this
- Open the original source.
- Record the complete citation and publication date.
- Locate the methods and analytic population.
- Extract the estimate with its denominator and interval.
- Classify it as observed, pooled, adjusted, modeled, extrapolated, projected, or derived.
- Write one sentence the source supports in isolation.
- Write one common overstatement the source does not support.
- Compare the completed row against the original source again.
- Record the verification date.
- Increment the dataset version when a material row changes.
Versioning and corrections
- 1.0: Initial publication.
- 1.x: New rows, link repairs, clarifications, or non-methodological additions.
- 2.0: A new governing synthesis, major method change, or material replacement of the evidence structure.
Material corrections are recorded in the version history rather than silently overwritten.
What this data does and does not show
Every statistic on this page carries a limitation that changes how it can honestly be used. The largest symptom synthesis rated its own evidence certainty very low. The workplace figures come from a low-response survey at four sites. The treatment estimate is a partial measure of recorded care. None of that makes the numbers useless. It tells you what the numbers can carry.
- There is no single menopause symptom prevalence. Estimates depend on symptom, stage, age range, geography, instrument, recall period, and design.
- The symptom meta-analysis was extremely heterogeneous. The paper reports I² above 98% for all 19 pooled symptom estimates, and the authors rated GRADE certainty very low. The pooled values are reference estimates, not constants.
- Stage comparisons are not longitudinal. Higher pooled postmenopause estimates do not demonstrate that an individual’s symptoms rose over time. This applies directly to our stage-step decomposition.
- The 7.4-year duration figure is subgroup-specific. It describes SWAN participants who reported frequent vasomotor symptoms.
- The workplace figures are not national administrative totals. The response rate was 16.1%, the sample was 93.0% White, and the dollar estimate was extrapolated.
- The treatment estimate measures recorded treatment. The AARP/NORC method identified menopause when it was linked to a reported medical event and pooled multiple survey years.
- Race and ethnicity categories are study categories. Descriptive differences do not prove an innate cause or predict an individual outcome.
- Age 50 and older is not menopause status. WHO’s 26% is an age-based demographic measure.
- The 1.2-billion global figure is a projection. It was published in 1996, used age 50 as a proxy, and targets 2030.
- The evidence uses source terminology. WHO notes that much available menopause data use the category “women” and often do not identify gender identity; evidence for transgender and gender-diverse populations is comparatively sparse. Where this page says “women,” it reflects the populations and terminology used by the cited sources.
- This audit did not identify a harmonized current count of U.S. women who are perimenopausal or postmenopausal, or an original current national calculation supporting one exact annual menopause-incidence figure. We published the gap rather than manufacturing a count.
- This is educational research, not medical advice. Midlife symptoms can have causes unrelated to menopause. A qualified healthcare professional can assess an individual history, symptoms, and treatment options.
Statistics we excluded or reclassified — and why
An audit is only credible if it says what it left out.
| Figure or claim | Decision | Reason |
|---|---|---|
| “Exactly 6,000 U.S. women reach menopause every day” as a verified current national count | Excluded as an exact current count | The figure is repeated in Whiteley and SWHR, but this audit did not locate the original national incidence calculation that produced it. |
| “Exactly 1.3 million U.S. women reach menopause every year” as a verified official count | Excluded as an exact official count | The chain runs through StatPearls and a narrative review, and conflicts arithmetically with the 6,000-per-day figure. |
| “1.2 billion women are currently menopausal” | Reclassified | The traceable source is a 1996 projection to 2030 using age 50 as a proxy, not a current observation. |
| “26% of women worldwide are menopausal” | Excluded | WHO’s 26% measures women and girls aged 50 and older. |
| Any overall percentage created by combining the 19 symptom rates | Excluded | The symptom denominators overlap, vary by study, and cannot be added into an “any symptom” rate. |
| Our own cohort-flow estimate of annual U.S. menopause incidence | Withheld | The result would depend on modeling assumptions not carried by the quoted number. |
Source: The HRT Index Editorial Team. Decisions verified August 1, 2026.
How to cite this page
The HRT Index Editorial Team. “Menopause Statistics 2026: What the Evidence Shows and Where Each Number Comes From.” The HRT Index Research. Published and last verified August 1, 2026. https://thehrtindex.com/research/menopause-statistics/
Dataset: The HRT Index Menopause Statistics Evidence Ledger, version 1.0.
Frequently asked questions
What is the average age of menopause?
Most women experience natural menopause between ages 45 and 55, according to WHO. NIH gives an average U.S. age of 51, CDC says menopause usually occurs around age 52, and SWAN reported a cohort median natural final-menstrual-period age of 52.54.
What percentage of women experience menopause symptoms?
There is no single percentage. A 2024 meta-analysis of 321 studies covering 482,067 middle-aged women reported pooled estimates for 19 symptoms ranging from 20.50% to 65.43%. Seven of the 19 point estimates were above 50%, and the authors rated the evidence certainty very low.
What was the highest pooled menopause symptom estimate?
Joint and muscular discomfort had the highest point estimate among the 19 symptoms in the 2024 meta-analysis, at 65.43% with a 95% confidence interval of 62.51% to 68.29%. That result belongs to one highly heterogeneous synthesis and should not be restated as a universal rate.
What percentage of women have hot flashes?
The 2024 meta-analysis estimated pooled hot-flash prevalence at 52.65% among middle-aged women. Its stage-specific estimates were 31.31% in premenopause, 56.52% in perimenopause, and 56.74% in postmenopause. Figures near 80% generally refer to the broader category of vasomotor symptoms and are often stated as an upper bound.
How long do hot flashes last?
Among 1,449 SWAN participants who reported frequent vasomotor symptoms, the median total duration was 7.4 years. Among 881 participants with an observable final menstrual period, the median persistence afterward was 4.5 years. These are subgroup medians, not averages for all women.
How many U.S. women reach menopause each year?
NIH states that more than 1 million U.S. women experience menopause each year. Two more precise figures — 6,000 per day and 1.3 million per year — are widely repeated but differ by 890,000 women annually and were not resolved in this audit to one original current national incidence calculation.
How many women worldwide are postmenopausal?
The audited sources do not provide a current observed global count based on directly measured menopause status. WHO reports that women aged 50 and older represented 26% of women and girls globally in 2021. A 1996 model using age 50 as a proxy projected 1.2 billion menopausal and postmenopausal women by 2030.
How common is primary ovarian insufficiency?
The current international guideline reports that non-iatrogenic primary ovarian insufficiency affects approximately 1% to 3.5% of women, depending on the study era and population. POI is defined as loss of ovarian activity before age 40.
What percentage of U.S. women receive menopause treatment?
An AARP/NORC analysis of pooled 2016–2021 MEPS data estimated that 5% of all U.S. women ages 45–64 were treated for menopause, equivalent to 2.1 million women in its average annual estimate. The report estimated that this represented about 20%–25% of women in menopause.
How does menopause affect work?
In a survey of 4,440 employed respondents at four Mayo Clinic sites, 13.4% reported at least one adverse work outcome attributed to menopause symptoms and 10.8% reported missed work. The study extrapolated $1.8 billion in annual U.S. lost work time; that figure is not a total economic cost.
Primary sources
- World Health Organization. “Menopause.” October 16, 2024.
- Centers for Disease Control and Prevention. “Menopause, Women’s Health, and Work.” November 14, 2024.
- NIH Office of Research on Women’s Health. “NIH Fact Sheets on Women’s Health Research.” Menopause section.
- Fang Y, Liu F, Zhang X, et al. “Mapping global prevalence of menopausal symptoms among middle-aged women: a systematic review and meta-analysis.” BMC Public Health. 2024;24:1767.
- Avis NE, Crawford SL, Greendale G, et al. “Duration of menopausal vasomotor symptoms over the menopause transition.” JAMA Internal Medicine. 2015;175(4):531–539.
- Gold EB, Crawford SL, Avis NE, et al. “Factors related to age at natural menopause: longitudinal analyses from SWAN.” American Journal of Epidemiology. 2013;178(1):70–83.
- Society for Women’s Health Research. “Menopause.” Accessed August 1, 2026.
- Whiteley J, DiBonaventura M, Wagner JS, Alvir J, Shah S. “The impact of menopausal symptoms on quality of life, productivity, and economic outcomes.” Journal of Women’s Health. 2013;22(11):983–990.
- Society for Women’s Health Research. “Women’s Health Disparities: Menopause.” Updated February 2025.
- Carlson K, Vadakekut ES. “Menopause.” StatPearls. Updated March 23, 2026.
- Crandall CJ, Mehta JM, Manson JE. “Management of Menopausal Symptoms: A Review.” JAMA. 2023;329(5):405–420.
- Yang L, Toriola AT. “Menopausal Hormone Therapy Use Among Postmenopausal Women.” JAMA Health Forum. 2024;5(9):e243128.
- Hill K. “The demography of menopause.” Maturitas. 1996;23(2):113–127.
- Panay N, Anderson RA, Bennie A, et al.; ESHRE, ASRM, CREWHIRL, and IMS Guideline Group on POI. “Evidence-based guideline: premature ovarian insufficiency.” Human Reproduction Open. 2024;2024(4):hoae065.
- Faubion SS, Enders F, Hedges MS, et al. “Impact of Menopause Symptoms on Women in the Workplace.” Mayo Clinic Proceedings. 2023;98(6):833–845.
- Carter B. “Women in Menopause Often Go Untreated.” AARP Public Policy Institute, April 17, 2025.
- Berman K. “After Decades of Misunderstanding, Menopause Is Finally Having Its Moment.” Yale School of Medicine, April 14, 2025.
Related research
- Menopause Diagnosis Statistics 2026 — what U.S. EHR, claims, survey, and treatment figures actually count
- Menopause Racial Disparities 2026 — nine primary U.S. studies and a normalized evidence map
- Menopause Workplace Cost: 2026 U.S. Data — component-by-component cost models and full state and industry tables
- How Many Women Use HRT? 2026 Statistics — source-specific HRT utilization figures with every denominator preserved
- Menopause Medical Education Statistics — training surveys and standards-language audit
- Menopause Research Funding: NIH 2007–2025 — the federal funding ledger and the arithmetic behind published totals
- Research and Reference Library — all non-commercial evidence assets from The HRT Index
Version history
Version 1.0 — August 1, 2026. Initial publication. Includes the 19-symptom pooled prevalence table; original arithmetic summaries; stage comparison and non-longitudinal step decomposition; U.S. age reconciliation; annual-incidence source-chain audit; historical global-projection classification; duration, work, treatment, and POI evidence; claim audit; exclusions; machine-readable data; and two original visualizations.
The HRT Index Research is an independent research and reference resource on women’s midlife health, built from dated primary sources and transparent methods.