Animals That Go Through Menopause: 6 Wild Species, Graded by Evidence
By The HRT Index Editorial Team · Updated September 2026
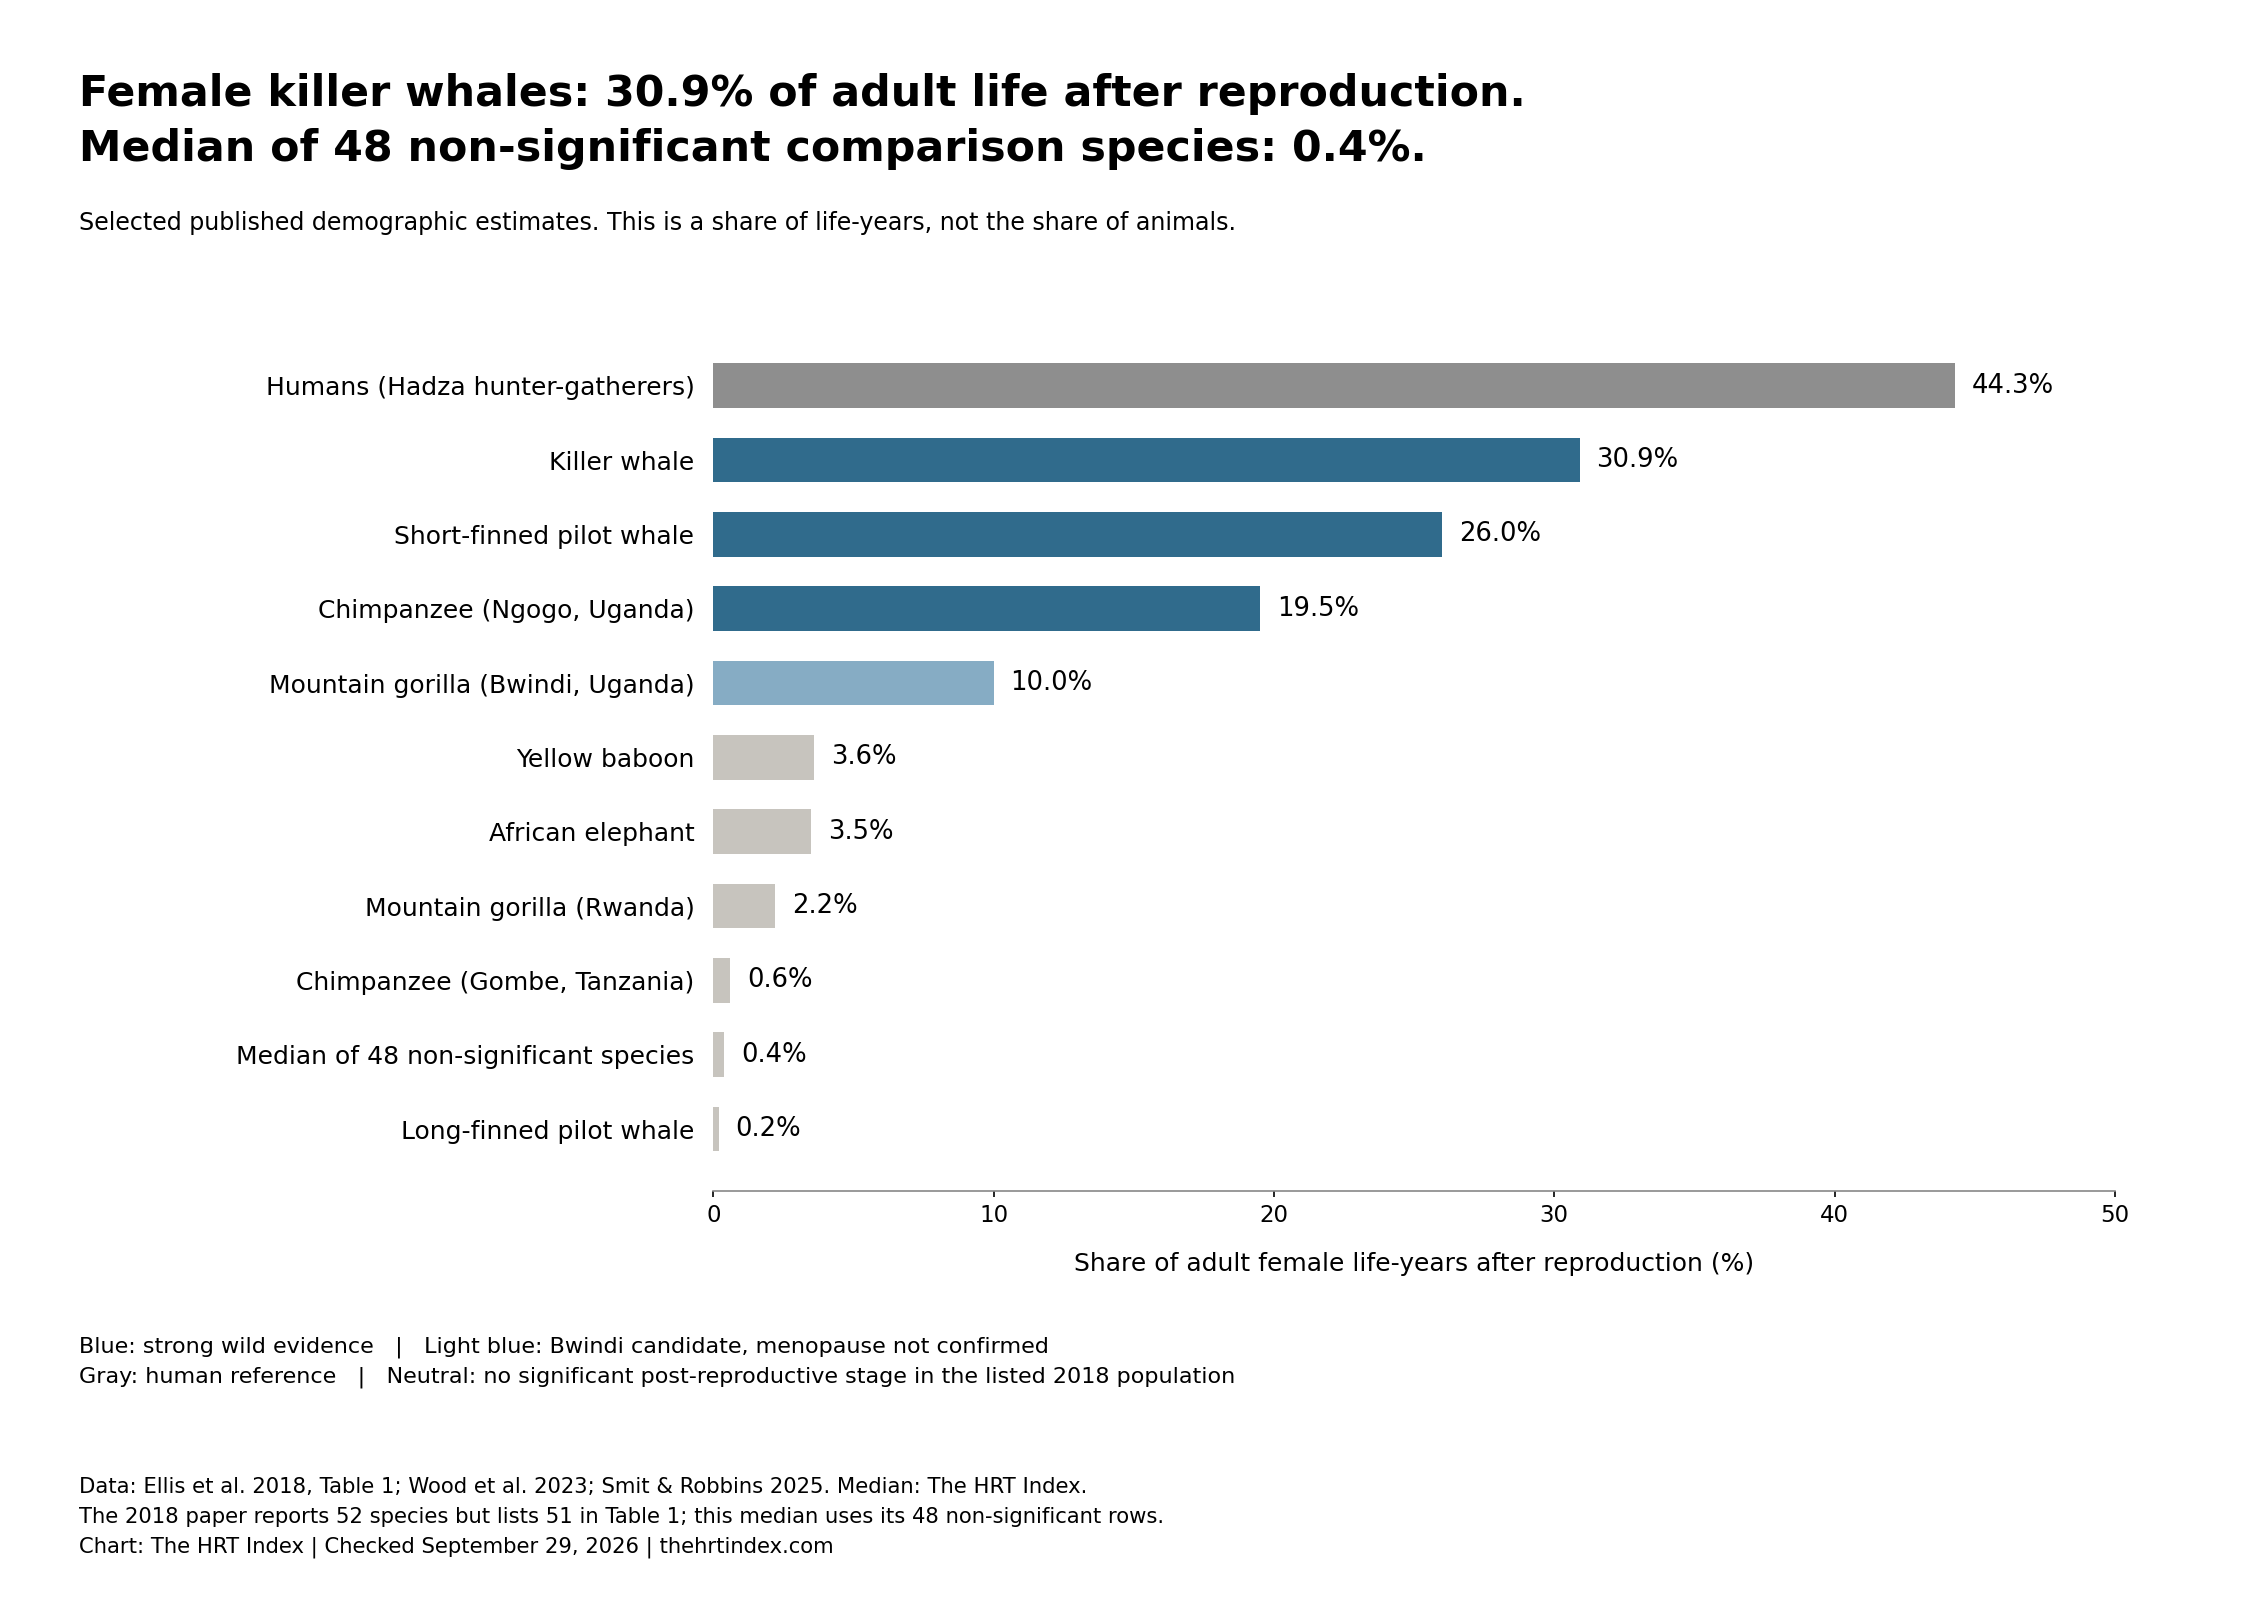
Animals that go through menopause include five toothed whale species and chimpanzees at Ngogo, Uganda, besides humans. The HRT Index's September 2026 review counts six mammals with strong evidence in wild populations. In one 2018 comparison, female killer whales spent 30.9% of adult life after reproduction; the median among its 48 listed non-significant species was 0.4%.
A seventh wild mammal is a candidate. And zoo animals tell a very different story. Here's the evidence, graded, with the free data. The six-species count covers this defined evidence set, not every animal ever reported to stop reproducing.
Key animal menopause statistics
- Besides humans, six mammals in this review have strong evidence of menopause in wild populations: killer whales, short-finned pilot whales, false killer whales, belugas, narwhals, and chimpanzees in the Ngogo community of Uganda. (The HRT Index review of Ellis et al. 2024, Nature and Wood et al. 2023, Science, September 2026.)
- Female killer whales spend 30.9% of their adult years after reproduction ends, the highest wild non-human value in Table 1 of a 2018 mammal comparison. The measure is called post-reproductive representation, or PrR; theirs is 0.309. (Ellis et al. 2018, Ecology and Evolution.)
- In the 2018 study's Table 1, 48 of 51 listed species had a PrR share of 3.6% or less and no significant post-reproductive stage. Their median was 0.4%, calculated by The HRT Index. The article reports 52 species, but lists 51 in that table. (Ellis et al. 2018, Table 1; count note.)
- In the 2018 table, the female killer-whale post-reproductive share is 8.6 times the largest share among the 48 non-significant species (30.9% vs 3.6% for yellow baboons). (The HRT Index calculation from Ellis et al. 2018, Table 1.)
- Menopause evolved at least four separate times across five toothed whale species. (Ellis et al. 2024, Nature.)
- Toothed whales with menopause are predicted to have a typical maximum lifespan about 40 years longer (mean ± standard deviation: 40 ± 5 years) than female toothed whales of the same size without it. (Ellis et al. 2024; modeled difference, not years caused by menopause in an individual.)
- At Ngogo, Uganda, records for 185 female chimpanzees from 1995 to 2016 showed no births after age 50 and an estimated 19.5% of adult female life-years after reproduction. Urine from 66 females showed menopause-like hormone changes. (Wood et al. 2023, Science.)
- Chimpanzees at Gombe, Tanzania, had an estimated 0.6% of adult life after reproduction; Ngogo's 19.5% share was 32.5 times as large. (Ellis et al. 2018, Table 1; Wood et al. 2023; The HRT Index calculation.)
- Wild mountain gorillas at Bwindi, Uganda, spent 10% of adult life after reproduction in a 2025 study, and 7 of 25 females lived 10 or more years past their last birth. The study could not confirm menopause as the cause. (Smit and Robbins 2025, PNAS.)
- Three selected older wild–zoo comparisons give zoo PrR shares 12.4 to 49.4 times as large. Japanese macaques: 24.7% in zoos vs 0.5% in the wild. Using Ngogo instead of the older wild chimpanzee composite gives 1.15 times, not 12.4. (Levitis et al. 2013, Table 1; Ellis et al. 2018; Wood et al. 2023; The HRT Index calculations.)
- Five additional primates in this ledger have captive menopause or post-reproductive reports: rhesus macaques, Japanese macaques, western gorillas, Sumatran orangutans and Bornean orangutans. (Walker 1995; Atsalis and Margulis 2006; MacLachlan et al., online 2024; issue 2025; Wood et al. 2023, Table 1.)
- Resident killer whales whose maternal grandmother had died within the previous two years had a mortality hazard ratio of 4.5, versus whales with a living grandmother, at salmon index 1. This compares death rates over time, not each whale's chance of dying. (Nattrass et al. 2019, PNAS.)
- When resident killer whale mothers and daughters had calves at the same time, the older generation's calves had a mortality hazard ratio of 1.7, versus the younger generation's calves, in 43 years of records. (Croft et al. 2017, Current Biology.)
- Most unspayed female dogs keep having heat cycles throughout life, with gaps that may grow with age. (Hanim and Chotimanukul 2025, Journal of Veterinary Science.)
On this page: The list · Look up an animal · Why counts disagree · Whales · Chimps and gorillas · Elephants · Dogs and cats · Animals that don't · How scientists tell · What it means for women · Method · Limits · Cite · Download · FAQ · Sources
Which animals go through menopause?
Six mammals besides humans have strong evidence in the wild in this review: five toothed whale species and chimpanzees at Ngogo in Uganda. One more wild mammal, the mountain gorilla at Bwindi, shows the pattern but isn't confirmed. Five other primates in the ledger have captive reports.
For this wild-mammal list, menopause means lasting loss of ovarian reproductive function with a long life afterward. Living after the last birth is related, but is not by itself a diagnosis. In people, doctors confirm it after 12 months in a row with no period and no other cause (World Health Organization). Whales don't have periods you can count. So scientists check other things: birth records, ovaries and hormones.
Most wild mammals studied this way do not have a long post-reproductive stage. They're like a shop that stays open until closing time. The strongest examples below close early and keep living.
| Animal | Where it was studied | What the evidence is | Share of adult life after reproduction | Our grade | Key study |
|---|---|---|---|---|---|
| Humans (Hadza hunter-gatherers) | Tanzania | Birth and death records | 44.3% | Reference | Ellis et al. 2018 |
| Killer whale (orca) | Wild populations | Birth and death records | 30.9% | Strong, in the wild | Ellis et al. 2018; Ellis et al. 2024 |
| Short-finned pilot whale | Wild-origin samples | Demographic data, plus ovaries | 26.0% demographic; 15.0% ovary-based | Strong, in the wild | Ellis et al. 2018 (life tables; ovaries) |
| Chimpanzee | Ngogo community, Uganda | Birth and death records, plus urine hormones | 19.5% | Strong, in the wild (one community) | Wood et al. 2023 |
| False killer whale | South Africa and Japan, wild-origin samples | Ovaries and demographic data | 14.0% demographic (combined sample) | Strong, in the wild | Photopoulou et al. 2017 |
| Beluga | Wild-origin samples | Ovaries by age | 27.0% ovary-based | Strong, in the wild | Ellis et al. 2018 |
| Narwhal | Wild-origin samples | Ovaries by age | 24.0% ovary-based | Strong, in the wild | Ellis et al. 2018 |
| Mountain gorilla | Bwindi, Uganda | Birth and death records | 10.0% | Likely, not confirmed | Smit and Robbins 2025 |
| Rhesus macaque | Research colony; zoos | Blood hormones and ovaries; zoo records | 17.8% (zoos) | Captive evidence | Walker 1995; Levitis et al. 2013, Table 1 |
| Western gorilla | Zoos | Hormone cycles; zoo records | Number withheld† | Captive evidence | Atsalis and Margulis 2006; Wood et al. 2023, Table 1 |
| Sumatran orangutan | One zoo female in Jersey; zoos | Ultrasound, blood hormones, tissue; zoo records | Number withheld† | Captive evidence | MacLachlan et al., online 2024; issue 2025; Wood et al. 2023, Table 1 |
| Japanese macaque | Zoos | Zoo records | 24.7% (zoos) | Captive evidence | Levitis et al. 2013, Table 1 |
| Bornean orangutan | Zoos | Zoo records | Number withheld† | Captive evidence | Wood et al. 2023, Table 1 |
| Asian elephant | Semi-captive timber elephants, Myanmar | Birth and death records | 16.2% demographic | Post-reproductive life; menopause not established | Chapman et al. 2019 |
Source: The HRT Index Animal Menopause Evidence Ledger v1.1, compiled from the linked studies; checked September 29, 2026. Demographic percentages are PrR × 100. Ovary-based percentages are Phys-PrR × 100 under the stable-population model: a related but different measure, not a birth-record estimate. Verified zoo numbers come from Levitis et al. 2013, Table 1.
† A later table reports zoo PrR estimates for western gorillas and both orangutan species, but the original 2011 numerical appendix could not be checked. Those three numbers are withheld, not zero. The separate gorilla hormone study and single-orangutan case remain included.
Here's how to read that middle number. Picture 100 years of adult life, added up across a group of grown females. For killer whales, 30.9 of those years fall after the age marking 95% of lifetime fertility. That's the same fraction as close to 4 months of a year—not a yearly break from breeding. For the median of the 48 listed non-significant species in the 2018 table, it's 0.4 years out of 100, the same fraction as about a day and a half of a year.
The five toothed whales
Killer whales (orcas), short-finned pilot whales, false killer whales, belugas and narwhals are the five whales with menopause (Ellis et al. 2024). All five are toothed whales, the group that includes dolphins. Big filter-feeding whales are a different group; the one tested in Ellis et al. 2018, the fin whale, had an estimated 0.6% of adult life after reproduction.
The proof isn't the same for each. For killer whales, scientists used decades of birth and death records. For belugas and narwhals, they looked at ovaries. Egg release leaves structures in the ovary called corpora. These can persist, so their pattern with age helps researchers estimate ovarian activity; they are not a perfect one-scar-per-egg lifetime counter. Ellis et al. 2018 used that method. Short-finned pilot whales passed both demographic and ovarian tests.
The false killer whale results differ by test. Photopoulou et al. 2017 reported a significant demographic PrR of 14.0% in combined South African and Japanese samples. The 2018 ovarian test of Japanese animals was not significant. The 2024 synthesis still includes false killer whales among the five species.
One name trips people up. "Pilot whale" is two species. Short-finned pilot whales go through menopause. Long-finned pilot whales don't, at least not across the species: their share in 2018 was 0.2%, and a 2020 genetic study used 1,522 whales in 22 pods to examine why the species lacks a widespread post-reproductive lifespan (Nichols et al. 2020). In the 2018 demographic table, short-finned pilot whales' 26.0% share is 130 times as large as the long-finned share of 0.2%.
Chimpanzees at Ngogo
Wild chimpanzees in the Ngogo community of Kibale National Park, Uganda, are the non-whale mammals with strong wild-population evidence in this review. Researchers followed 185 females from 1995 to 2016. None gave birth after 50. Hormones in 560 urine samples from 66 females looked like human menopause: the signals that push the ovaries (called FSH and LH) rose sharply after 50 (Wood et al. 2023).
That's one community. More on why that matters below.
The seventh candidate: mountain gorillas at Bwindi
In October 2025, a study of 25 adult female mountain gorillas at Bwindi Impenetrable National Park, Uganda, found a significant life stage after reproduction: 10% of adult life. Seven of the 25 lived at least 10 years past their last birth (Smit and Robbins 2025).
The authors are careful. Their methods can't tell menopause apart from other reasons a female stops having babies, like losing pregnancies. They call menopause "a highly plausible cause." That's why we grade it "likely," not "strong."
Five more with captive evidence
Five other primates show menopause or long life after reproduction in captivity in this ledger:
- Rhesus macaques. In a 1995 study of 15 females aged 8 to 34, six aged 27 to 34 were classified as postmenopausal, with high LH and low estradiol (a form of estrogen). Ovaries from four of them showed little or no egg development (Walker 1995). One of the six had signs of a possible isolated ovulation; the author still classified her as postmenopausal.
- Western lowland gorillas. In a zoo study, among 22 females aged 30 or older, about 23% had stopped cycling, and about 32% showed patterns that looked like perimenopause (Atsalis and Margulis 2006).
- Sumatran orangutans. One previously fertile zoo female in Jersey, about 50 years old, had low estradiol, high FSH and ultrasound and tissue findings consistent with natural menopause (MacLachlan et al., online 2024; issue 2025). That's one animal, not a rate.
- Japanese macaques and Bornean orangutans. Japanese macaques have a 24.7% zoo PrR estimate in Levitis et al. 2013, Table 1. Bornean orangutan post-reproductive survival is listed in Wood et al. 2023, Table 1, but its original numerical appendix could not be checked, so that number is withheld here.
Zoo evidence is real. It just answers a different question. It shows what can happen under captive conditions, which can change both survival and reproduction. It does not by itself show how common the same pattern is in the wild.
Look up an animal
Type an animal and see its row from our ledger: the grade, the setting, the number and the study. If an animal isn't in the ledger, the lookup says so. That means we have no study on it here, not that the animal has no menopause.
Strong evidence in the wild
Killer whale (orca)
Orcinus orca
- Measures
30.9% of adult life-years (demographic PrR)
Ovary-based Phys-PrR: Not reported in this record
Age M (95% of summed age-specific fertility): 41 years
- Finding
- Significant life stage after reproduction in the wild
- Population
- Not reported in this record
- Limit
- One population; values from different studies use different data periods
- Verification
- Verified against primary full text
- Source location
- Table 1; Methods 2.2-2.5
- Verification date
- Checked 2026-09-29
Strong evidence in the wild
Short-finned pilot whale
Globicephala macrorhynchus
- Measures
26.0% of adult life-years (demographic PrR)
Ovary-based Phys-PrR: Not reported in this record
Age M (95% of summed age-specific fertility): 34 years
- Published scenario range
13.1%–35.2% demographic PrR. These are not confidence intervals.
Metric notes
Demographic PrR: estimated post-reproductive adult female life-years / all adult female life-years; not a percentage of females. B and M definitions follow the source. Ellis 2018 uses first observed reproduction for age B; M is 95% of summed age-specific fecundity, independent of mortality. Table 1 values used consistently; prose differs for humans and orcas. Scenario endpoints are sensitivity results under alternative population growth assumptions, not confidence limits.
- Finding
- Significant life stage after reproduction in the wild
- Population
- Not reported in this record
- Limit
- Population-growth sensitivity range 0.131-0.352; one population
- Verification
- Verified against primary full text
- Source location
- Table 1; Methods 2.2-2.5
- Verification date
- Checked 2026-09-29
Strong evidence in the wild
Chimpanzee (Ngogo community, Uganda)
Pan troglodytes
- Measures
19.5% of adult life-years (demographic PrR)
Ovary-based Phys-PrR: Not reported in this record
Age M (95% of summed age-specific fertility): 47 years
- Finding
- No births after age 50; hormones rose sharply after 50 as in human menopause
- Population
- 185 females tracked 1995-2016; 560 urine samples from 66 females
- Limit
- Ngogo community only; demographic years 1995-2016. Major respiratory outbreak occurred in 2017, after that observation window. Older ages were estimated; hormonal samples and demographic sample differ.
- Verification
- Verified against primary full text
- Source location
- Results; Table 1; Materials and Methods (PrR and urinary hormones)
- Verification date
- Checked 2026-09-29
Strong evidence in the wild
False killer whale
Pseudorca crassidens
- Measures
14.0% of adult life-years (demographic PrR)
Ovary-based Phys-PrR: Not reported in this record
Age M (95% of summed age-specific fertility): 39 years
- Finding
- Combined South African and Japanese sample: demographic PrR 0.14 (14.0%) and ovarian evidence of a post-reproductive phase.
- Population
- 91 females with age data; 137 with reproductive organs examined
- Limit
- South Africa 1981 stranding and Japan 1979-1980 harvest samples. Separate demographic PrR estimates were 0.37 and 0.12. A 2018 ovarian-based test of Japanese false killer whales was not significant; the 2024 synthesis still includes the species.
- Verification
- Verified against primary full text
- Source location
- Abstract; Results; Table 2
- Verification date
- Checked 2026-09-29
Strong evidence in the wild
Beluga whale
Delphinapterus leucas
- Measures
Demographic PrR: Not reported in this record
27.0% (ovary-based Phys-PrR; stable-population model)
Age M: Not reported in this record
- Published scenario range
19%–33% ovary-based Phys-PrR. These are not confidence intervals.
Metric notes
Phys-PrR: ovarian-activity-based estimate using physiological fecundity, not births. Central value assumes a stable population. Scenario endpoints use declining/growing populations, not confidence intervals. Do not merge with demographic PrR.
- Finding
- Ovary-based Phys-PrR of 0.27 (27.0%) under the stable-population model; significant (p < 0.001).
- Population
- 1 of 3 positive species among 16 toothed whale species with ovary data
- Limit
- Wild-origin ovarian samples and modeled survival; this is not a direct birth-record PrR estimate.
- Verification
- Verified against primary full text
- Source location
- Table 1; physiological PrR Methods
- Verification date
- Checked 2026-09-29
Strong evidence in the wild
Narwhal
Monodon monoceros
- Measures
Demographic PrR: Not reported in this record
24.0% (ovary-based Phys-PrR; stable-population model)
Age M: Not reported in this record
- Published scenario range
19%–29% ovary-based Phys-PrR. These are not confidence intervals.
Metric notes
Phys-PrR: ovarian-activity-based estimate using physiological fecundity, not births. Central value assumes a stable population. Scenario endpoints use declining/growing populations, not confidence intervals. Do not merge with demographic PrR.
- Finding
- Ovary-based Phys-PrR of 0.24 (24.0%) under the stable-population model; significant (p < 0.001).
- Population
- 1 of 3 positive species among 16 toothed whale species with ovary data
- Limit
- Wild-origin ovarian samples and modeled survival; this is not a direct birth-record PrR estimate.
- Verification
- Verified against primary full text
- Source location
- Table 1; physiological PrR Methods
- Verification date
- Checked 2026-09-29
Strong evidence in the wild
Short-finned pilot whale (ovary data)
Globicephala macrorhynchus
- Measures
Demographic PrR: Not reported in this record
15.0% (ovary-based Phys-PrR; stable-population model)
Age M: Not reported in this record
- Published scenario range
8%–22% ovary-based Phys-PrR. These are not confidence intervals.
Metric notes
Phys-PrR: ovarian-activity-based estimate using physiological fecundity, not births. Central value assumes a stable population. Scenario endpoints use declining/growing populations, not confidence intervals. Do not merge with demographic PrR.
- Finding
- Ovary-based Phys-PrR of 0.15 (15.0%) under the stable-population model; significant (p < 0.001).
- Population
- 1 of 3 positive species among 16 toothed whale species with ovary data
- Limit
- Wild-origin ovarian samples and modeled survival; this is not a direct birth-record PrR estimate.
- Verification
- Verified against primary full text
- Source location
- Table 1; physiological PrR Methods
- Verification date
- Checked 2026-09-29
Likely in the wild, not confirmed
Mountain gorilla (Bwindi, Uganda)
Gorilla beringei
- Measures
10.0% of adult life-years (demographic PrR)
Ovary-based Phys-PrR: Not reported in this record
Age M: Not reported in this record
- Finding
- Significant life after reproduction; authors call menopause a highly plausible cause
- Population
- 25 adult females in 4 groups; 7 lived 10+ years past their last birth
- Limit
- Methods cannot tell menopause from other causes of infertility; no hormone or ovary data in this study
- Verification
- Verified against primary full text
- Source location
- Results; demographic methods
- Verification date
- Checked 2026-09-29
Captive evidence
Japanese macaque (zoos)
Macaca fuscata
- Measures
24.7% of adult life-years (demographic PrR)
Ovary-based Phys-PrR: Not reported in this record
Age M (95% of summed age-specific fertility): 21 years
- Finding
- Significant life after reproduction in zoos
- Population
- Not reported in this record
- Limit
- Zoo-living composite; original ISIS inputs are restricted. Published estimate checked; raw life tables not reanalyzed.
- Source
- Levitis, Burger and Lackey 2013, Evolutionary Anthropology 22:66-79, Table 1 Read-through source
- Verification
- Verified against primary full text
- Source location
- Table 1; Box 1
- Verification date
- Checked 2026-09-29
Captive evidence
Chimpanzee (zoos)
Pan troglodytes
- Measures
22.4% of adult life-years (demographic PrR)
Ovary-based Phys-PrR: Not reported in this record
Age M (95% of summed age-specific fertility): 40 years
- Finding
- Significant life after reproduction in zoos
- Population
- Not reported in this record
- Limit
- Zoo-living composite; original ISIS inputs are restricted. Published estimate checked; raw life tables not reanalyzed.
- Source
- Levitis, Burger and Lackey 2013, Evolutionary Anthropology 22:66-79, Table 1 Read-through source
- Verification
- Verified against primary full text
- Source location
- Table 1; Box 1
- Verification date
- Checked 2026-09-29
Captive evidence
Rhesus macaque (zoos)
Macaca mulatta
- Measures
17.8% of adult life-years (demographic PrR)
Ovary-based Phys-PrR: Not reported in this record
Age M (95% of summed age-specific fertility): 24 years
- Finding
- Significant life after reproduction in zoos
- Population
- Not reported in this record
- Limit
- Zoo-living composite; original ISIS inputs are restricted. Published estimate checked; raw life tables not reanalyzed.
- Source
- Levitis, Burger and Lackey 2013, Evolutionary Anthropology 22:66-79, Table 1 Read-through source
- Verification
- Verified against primary full text
- Source location
- Table 1; Box 1
- Verification date
- Checked 2026-09-29
Captive evidence
Japanese macaque (provisioned sanctuary, Texas)
Macaca fuscata
- Measures
5.4% of adult life-years (demographic PrR)
Ovary-based Phys-PrR: Not reported in this record
Age M (95% of summed age-specific fertility): 22 years
- Finding
- Some life after reproduction when fed by people
- Population
- Not reported in this record
- Limit
- Provisioned/semi-free-ranging population, not unprovisioned wild animals. Table 1 gives 0.054; the 2013 figure caption rounds/displays 0.055. Table value retained.
- Source
- Levitis, Burger and Lackey 2013, Evolutionary Anthropology 22:66-79, Table 1 Read-through source
- Verification
- Verified against primary full text
- Source location
- Table 1; Box 1
- Verification date
- Checked 2026-09-29
Captive evidence
Western gorilla (zoos)
Gorilla gorilla
- Measures
Original numeric source unavailable — estimate withheld
- Finding
- Zoo-living post-reproductive survival is reported in Wood et al. 2023 Table 1; its original numerical appendix could not be independently checked.
- Population
- Not reported in this record
- Limit
- Original Appendix S2 download blocked. Numeric PrR withheld, not zero and not a claim that no estimate exists. Captive demographic record, not physiological proof of menopause.
- Source
- Levitis and Lackey 2011, Methods in Ecology and Evolution 2:446-453, Appendix S2; record reproduced in Wood et al. 2023 Table 1 Read-through source
- Verification
- Secondary record; numeric estimate withheld
- Source location
- Original Appendix S2 (unavailable); Wood 2023 Table 1 (read)
- Verification date
- Checked 2026-09-29
Captive evidence
Sumatran orangutan (zoos)
Pongo abelii
- Measures
Original numeric source unavailable — estimate withheld
- Finding
- Zoo-living post-reproductive survival is reported in Wood et al. 2023 Table 1; its original numerical appendix could not be independently checked.
- Population
- Not reported in this record
- Limit
- Original Appendix S2 download blocked. Numeric PrR withheld, not zero and not a claim that no estimate exists. Captive demographic record, not physiological proof of menopause.
- Source
- Levitis and Lackey 2011, Methods in Ecology and Evolution 2:446-453, Appendix S2; record reproduced in Wood et al. 2023 Table 1 Read-through source
- Verification
- Secondary record; numeric estimate withheld
- Source location
- Original Appendix S2 (unavailable); Wood 2023 Table 1 (read)
- Verification date
- Checked 2026-09-29
Captive evidence
Bornean orangutan (zoos)
Pongo pygmaeus
- Measures
Original numeric source unavailable — estimate withheld
- Finding
- Zoo-living post-reproductive survival is reported in Wood et al. 2023 Table 1; its original numerical appendix could not be independently checked.
- Population
- Not reported in this record
- Limit
- Original Appendix S2 download blocked. Numeric PrR withheld, not zero and not a claim that no estimate exists. Captive demographic record, not physiological proof of menopause.
- Source
- Levitis and Lackey 2011, Methods in Ecology and Evolution 2:446-453, Appendix S2; record reproduced in Wood et al. 2023 Table 1 Read-through source
- Verification
- Secondary record; numeric estimate withheld
- Source location
- Original Appendix S2 (unavailable); Wood 2023 Table 1 (read)
- Verification date
- Checked 2026-09-29
Captive evidence
Rhesus macaque (research colony)
Macaca mulatta
- Measures
Demographic PrR: Not reported in this record
Ovary-based Phys-PrR: Not reported in this record
Age M: Not reported in this record
- Finding
- Six of 15 captive females, aged 27-34, were classified as postmenopausal during the 1991 observation year; ovarian tissue was available from four.
- Population
- 15 females aged 8-34 followed 1 year; 6 postmenopausal (ages 27-34); ovaries of 4 examined
- Limit
- Age-selected sample, not prevalence. One of the six had evidence of a possible isolated ovulation; the author still classified her as postmenopausal.
- Verification
- Verified against primary full text
- Source location
- Abstract; Tables I-II; Results, Menopause
- Verification date
- Checked 2026-09-29
Captive evidence
Western lowland gorilla (zoo study)
Gorilla gorilla
- Measures
Demographic PrR: Not reported in this record
Ovary-based Phys-PrR: Not reported in this record
Age M: Not reported in this record
- Finding
- Some older females stopped cycling (menopause); about 32% showed perimenopause-like patterns
- Population
- 30 females; 22 aged 30 or older; about 23% of those were acyclic
- Limit
- Hormone cycles only; zoo population
- Verification
- Verified Primary Abstract
- Source location
- Publisher abstract, age-30-plus subgroup
- Verification date
- Checked 2026-09-29
Captive evidence
Sumatran orangutan (one zoo female, Jersey)
Pongo abelii
- Measures
Demographic PrR: Not reported in this record
Ovary-based Phys-PrR: Not reported in this record
Age M: Not reported in this record
- Finding
- Low estradiol and high FSH; findings consistent with natural menopause
- Population
- 1 female, about 50 years old, previously fertile
- Limit
- One animal; no rate or typical age can be drawn
- Verification
- Verified Primary Abstract
- Source location
- Publisher abstract and publication history
- Verification date
- Checked 2026-09-29
Post-reproductive life; menopause not established
Asian elephant (semi-captive timber elephants, Myanmar)
Elephas maximus
- Measures
16.2% of adult life-years (demographic PrR)
Ovary-based Phys-PrR: Not reported in this record
Age M (95% of summed age-specific fertility): 55 years
- Finding
- Full-population demographic PrR 0.162 (16.2%); the authors judged physiological reproductive cessation an unlikely cause.
- Population
- 3,802 female semi-captive timber elephants; records through 2018
- Limit
- Semi-captive Myanmar timber elephants, not a wild population. Captive-born subgroup PrR 0.207; age-bias sensitivity estimates 0.148-0.207 across analyses are not confidence limits or proof of menopause.
- Verification
- Verified against primary full text
- Source location
- Table 1; Results and Discussion
- Verification date
- Checked 2026-09-29
Wild result: no significant post-reproductive stage
Yellow baboon
Papio cynocephalus
- Measures
3.6% of adult life-years (demographic PrR)
Ovary-based Phys-PrR: Not reported in this record
Age M (95% of summed age-specific fertility): 21 years
- Finding
- No significant life stage after reproduction in this wild population
- Population
- Not reported in this record
- Limit
- One population; values from different studies use different data periods
- Verification
- Verified against primary full text
- Source location
- Table 1; Methods 2.2-2.5
- Verification date
- Checked 2026-09-29
Wild result: no significant post-reproductive stage
African elephant
Loxodonta africana
- Measures
3.5% of adult life-years (demographic PrR)
Ovary-based Phys-PrR: Not reported in this record
Age M (95% of summed age-specific fertility): 59 years
- Finding
- No significant life stage after reproduction in this wild population
- Population
- Not reported in this record
- Limit
- One population; values from different studies use different data periods
- Verification
- Verified against primary full text
- Source location
- Table 1; Methods 2.2-2.5
- Verification date
- Checked 2026-09-29
Wild result: no significant post-reproductive stage
American bison
Bison bison
- Measures
2.9% of adult life-years (demographic PrR)
Ovary-based Phys-PrR: Not reported in this record
Age M (95% of summed age-specific fertility): 17 years
- Published scenario range
0.9%–4.8% demographic PrR. These are not confidence intervals.
Metric notes
Demographic PrR: estimated post-reproductive adult female life-years / all adult female life-years; not a percentage of females. B and M definitions follow the source. Ellis 2018 uses first observed reproduction for age B; M is 95% of summed age-specific fecundity, independent of mortality. Table 1 values used consistently; prose differs for humans and orcas. Scenario endpoints are sensitivity results under alternative population growth assumptions, not confidence limits.
- Finding
- No significant life stage after reproduction in this wild population
- Population
- Not reported in this record
- Limit
- Population-growth sensitivity range 0.009-0.048; one population
- Verification
- Verified against primary full text
- Source location
- Table 1; Methods 2.2-2.5
- Verification date
- Checked 2026-09-29
Wild result: no significant post-reproductive stage
Mountain gorilla (Rwanda)
Gorilla beringei
- Measures
2.2% of adult life-years (demographic PrR)
Ovary-based Phys-PrR: Not reported in this record
Age M (95% of summed age-specific fertility): 38 years
- Finding
- No significant life stage after reproduction in this wild population
- Population
- Not reported in this record
- Limit
- One population; values from different studies use different data periods
- Verification
- Verified against primary full text
- Source location
- Table 1; Methods 2.2-2.5
- Verification date
- Checked 2026-09-29
Wild result: no significant post-reproductive stage
Moose
Alces alces
- Measures
2.0% of adult life-years (demographic PrR)
Ovary-based Phys-PrR: Not reported in this record
Age M (95% of summed age-specific fertility): 15 years
- Published scenario range
0.7%–2.9% demographic PrR. These are not confidence intervals.
Metric notes
Demographic PrR: estimated post-reproductive adult female life-years / all adult female life-years; not a percentage of females. B and M definitions follow the source. Ellis 2018 uses first observed reproduction for age B; M is 95% of summed age-specific fecundity, independent of mortality. Table 1 values used consistently; prose differs for humans and orcas. Scenario endpoints are sensitivity results under alternative population growth assumptions, not confidence limits.
- Finding
- No significant life stage after reproduction in this wild population
- Population
- Not reported in this record
- Limit
- Population-growth sensitivity range 0.007-0.029; one population
- Verification
- Verified against primary full text
- Source location
- Table 1; Methods 2.2-2.5
- Verification date
- Checked 2026-09-29
Wild result: no significant post-reproductive stage
Olive baboon
Papio anubis
- Measures
2.0% of adult life-years (demographic PrR)
Ovary-based Phys-PrR: Not reported in this record
Age M (95% of summed age-specific fertility): 23 years
- Finding
- No significant life stage after reproduction in this wild population
- Population
- Not reported in this record
- Limit
- One population; values from different studies use different data periods
- Verification
- Verified against primary full text
- Source location
- Table 1; Methods 2.2-2.5
- Verification date
- Checked 2026-09-29
Wild result: no significant post-reproductive stage
Walrus
Odobenus rosmarus
- Measures
1.8% of adult life-years (demographic PrR)
Ovary-based Phys-PrR: Not reported in this record
Age M (95% of summed age-specific fertility): 24 years
- Published scenario range
0.8%–2.9% demographic PrR. These are not confidence intervals.
Metric notes
Demographic PrR: estimated post-reproductive adult female life-years / all adult female life-years; not a percentage of females. B and M definitions follow the source. Ellis 2018 uses first observed reproduction for age B; M is 95% of summed age-specific fecundity, independent of mortality. Table 1 values used consistently; prose differs for humans and orcas. Scenario endpoints are sensitivity results under alternative population growth assumptions, not confidence limits. Animal-group label checked against NOAA Fisheries: https://www.fisheries.noaa.gov/feature-story/it-seal-or-sea-lion .
- Finding
- No significant life stage after reproduction in this wild population
- Population
- Not reported in this record
- Limit
- Population-growth sensitivity range 0.008-0.029; one population
- Verification
- Verified against primary full text
- Source location
- Table 1; Methods 2.2-2.5
- Verification date
- Checked 2026-09-29
Wild result: no significant post-reproductive stage
Chimpanzee (five-site wild composite)
Pan troglodytes
- Measures
1.8% of adult life-years (demographic PrR)
Ovary-based Phys-PrR: Not reported in this record
Age M (95% of summed age-specific fertility): 45 years
- Finding
- No significant life stage after reproduction
- Population
- Gombe, Tai, Kanyawara, Mahale and Bossou combined
- Limit
- Compiled value from an earlier study
- Source
- Levitis, Burger and Lackey 2013, Evolutionary Anthropology 22:66-79, Table 1 Read-through source
- Verification
- Verified against primary full text
- Source location
- Table 1; Box 1
- Verification date
- Checked 2026-09-29
Wild result: no significant post-reproductive stage
Steller sea lion
Eumetopias jubatus
- Measures
1.7% of adult life-years (demographic PrR)
Ovary-based Phys-PrR: Not reported in this record
Age M (95% of summed age-specific fertility): 27 years
- Published scenario range
0.8%–2.9% demographic PrR. These are not confidence intervals.
Metric notes
Demographic PrR: estimated post-reproductive adult female life-years / all adult female life-years; not a percentage of females. B and M definitions follow the source. Ellis 2018 uses first observed reproduction for age B; M is 95% of summed age-specific fecundity, independent of mortality. Table 1 values used consistently; prose differs for humans and orcas. Scenario endpoints are sensitivity results under alternative population growth assumptions, not confidence limits.
- Finding
- No significant life stage after reproduction in this wild population
- Population
- Not reported in this record
- Limit
- Population-growth sensitivity range 0.008-0.029; one population
- Verification
- Verified against primary full text
- Source location
- Table 1; Methods 2.2-2.5
- Verification date
- Checked 2026-09-29
Wild result: no significant post-reproductive stage
Polar bear
Ursus maritimus
- Measures
1.3% of adult life-years (demographic PrR)
Ovary-based Phys-PrR: Not reported in this record
Age M (95% of summed age-specific fertility): 27 years
- Published scenario range
0.4%–1.9% demographic PrR. These are not confidence intervals.
Metric notes
Demographic PrR: estimated post-reproductive adult female life-years / all adult female life-years; not a percentage of females. B and M definitions follow the source. Ellis 2018 uses first observed reproduction for age B; M is 95% of summed age-specific fecundity, independent of mortality. Table 1 values used consistently; prose differs for humans and orcas. Scenario endpoints are sensitivity results under alternative population growth assumptions, not confidence limits.
- Finding
- No significant life stage after reproduction in this wild population
- Population
- Not reported in this record
- Limit
- Population-growth sensitivity range 0.004-0.019; one population
- Verification
- Verified against primary full text
- Source location
- Table 1; Methods 2.2-2.5
- Verification date
- Checked 2026-09-29
Wild result: no significant post-reproductive stage
Leopard
Panthera pardus
- Measures
1.2% of adult life-years (demographic PrR)
Ovary-based Phys-PrR: Not reported in this record
Age M (95% of summed age-specific fertility): 16 years
- Finding
- No significant life stage after reproduction in this wild population
- Population
- Not reported in this record
- Limit
- One population; values from different studies use different data periods
- Verification
- Verified against primary full text
- Source location
- Table 1; Methods 2.2-2.5
- Verification date
- Checked 2026-09-29
Wild result: no significant post-reproductive stage
Hippopotamus
Hippopotamus amphibius
- Measures
0.9% of adult life-years (demographic PrR)
Ovary-based Phys-PrR: Not reported in this record
Age M (95% of summed age-specific fertility): 41 years
- Finding
- No significant life stage after reproduction in this wild population
- Population
- Not reported in this record
- Limit
- One population; values from different studies use different data periods
- Verification
- Verified against primary full text
- Source location
- Table 1; Methods 2.2-2.5
- Verification date
- Checked 2026-09-29
Wild result: no significant post-reproductive stage
West Indian manatee
Trichechus manatus
- Measures
0.9% of adult life-years (demographic PrR)
Ovary-based Phys-PrR: Not reported in this record
Age M (95% of summed age-specific fertility): 56 years
- Published scenario range
0.3%–1.4% demographic PrR. These are not confidence intervals.
Metric notes
Demographic PrR: estimated post-reproductive adult female life-years / all adult female life-years; not a percentage of females. B and M definitions follow the source. Ellis 2018 uses first observed reproduction for age B; M is 95% of summed age-specific fecundity, independent of mortality. Table 1 values used consistently; prose differs for humans and orcas. Scenario endpoints are sensitivity results under alternative population growth assumptions, not confidence limits.
- Finding
- No significant life stage after reproduction in this wild population
- Population
- Not reported in this record
- Limit
- Population-growth sensitivity range 0.003-0.014; one population
- Verification
- Verified against primary full text
- Source location
- Table 1; Methods 2.2-2.5
- Verification date
- Checked 2026-09-29
Wild result: no significant post-reproductive stage
Rhesus macaque (wild)
Macaca mulatta
- Measures
0.7% of adult life-years (demographic PrR)
Ovary-based Phys-PrR: Not reported in this record
Age M (95% of summed age-specific fertility): 21 years
- Finding
- No significant life stage after reproduction
- Population
- Not reported in this record
- Limit
- The 2013 table gives no underlying demographic reference or named wild population; the published point estimate is verified, not its raw inputs.
- Source
- Levitis, Burger and Lackey 2013, Evolutionary Anthropology 22:66-79, Table 1 Read-through source
- Verification
- Verified against primary full text
- Source location
- Table 1; Box 1
- Verification date
- Checked 2026-09-29
Wild result: no significant post-reproductive stage
Chimpanzee (Gombe, Tanzania)
Pan troglodytes
- Measures
0.6% of adult life-years (demographic PrR)
Ovary-based Phys-PrR: Not reported in this record
Age M (95% of summed age-specific fertility): 50 years
- Finding
- No significant life stage after reproduction in this wild population
- Population
- Not reported in this record
- Limit
- One population; values from different studies use different data periods
- Verification
- Verified against primary full text
- Source location
- Table 1; Methods 2.2-2.5
- Verification date
- Checked 2026-09-29
Wild result: no significant post-reproductive stage
Fin whale
Balaenoptera physalus
- Measures
0.6% of adult life-years (demographic PrR)
Ovary-based Phys-PrR: Not reported in this record
Age M (95% of summed age-specific fertility): 95 years
- Published scenario range
0%–1.2% demographic PrR. These are not confidence intervals.
Metric notes
Demographic PrR: estimated post-reproductive adult female life-years / all adult female life-years; not a percentage of females. B and M definitions follow the source. Ellis 2018 uses first observed reproduction for age B; M is 95% of summed age-specific fecundity, independent of mortality. Table 1 values used consistently; prose differs for humans and orcas. Scenario endpoints are sensitivity results under alternative population growth assumptions, not confidence limits.
- Finding
- No significant life stage after reproduction in this wild population
- Population
- Not reported in this record
- Limit
- Population-growth sensitivity range 0-0.012; one population Historical whaling altered mortality; age 95 is the modeled M threshold, not a directly observed last birth.
- Verification
- Verified against primary full text
- Source location
- Table 1; Methods 2.2-2.5
- Verification date
- Checked 2026-09-29
Wild result: no significant post-reproductive stage
Plains zebra
Equus quagga
- Measures
0.6% of adult life-years (demographic PrR)
Ovary-based Phys-PrR: Not reported in this record
Age M (95% of summed age-specific fertility): 19 years
- Published scenario range
0.2%–1.1% demographic PrR. These are not confidence intervals.
Metric notes
Demographic PrR: estimated post-reproductive adult female life-years / all adult female life-years; not a percentage of females. B and M definitions follow the source. Ellis 2018 uses first observed reproduction for age B; M is 95% of summed age-specific fecundity, independent of mortality. Table 1 values used consistently; prose differs for humans and orcas. Scenario endpoints are sensitivity results under alternative population growth assumptions, not confidence limits.
- Finding
- No significant life stage after reproduction in this wild population
- Population
- Not reported in this record
- Limit
- Population-growth sensitivity range 0.002-0.011; one population
- Verification
- Verified against primary full text
- Source location
- Table 1; Methods 2.2-2.5
- Verification date
- Checked 2026-09-29
Wild result: no significant post-reproductive stage
Yellow-bellied marmot
Marmota flaviventris
- Measures
0.6% of adult life-years (demographic PrR)
Ovary-based Phys-PrR: Not reported in this record
Age M (95% of summed age-specific fertility): 12 years
- Finding
- No significant life stage after reproduction in this wild population
- Population
- Not reported in this record
- Limit
- One population; values from different studies use different data periods
- Verification
- Verified against primary full text
- Source location
- Table 1; Methods 2.2-2.5
- Verification date
- Checked 2026-09-29
Wild result: no significant post-reproductive stage
Blue monkey
Cercopithecus mitis
- Measures
0.5% of adult life-years (demographic PrR)
Ovary-based Phys-PrR: Not reported in this record
Age M (95% of summed age-specific fertility): 29 years
- Finding
- No significant life stage after reproduction in this wild population
- Population
- Not reported in this record
- Limit
- One population; values from different studies use different data periods
- Verification
- Verified against primary full text
- Source location
- Table 1; Methods 2.2-2.5
- Verification date
- Checked 2026-09-29
Wild result: no significant post-reproductive stage
Collared peccary
Pecari tajacu
- Measures
0.5% of adult life-years (demographic PrR)
Ovary-based Phys-PrR: Not reported in this record
Age M (95% of summed age-specific fertility): 15 years
- Published scenario range
0.2%–0.8% demographic PrR. These are not confidence intervals.
Metric notes
Demographic PrR: estimated post-reproductive adult female life-years / all adult female life-years; not a percentage of females. B and M definitions follow the source. Ellis 2018 uses first observed reproduction for age B; M is 95% of summed age-specific fecundity, independent of mortality. Table 1 values used consistently; prose differs for humans and orcas. Scenario endpoints are sensitivity results under alternative population growth assumptions, not confidence limits.
- Finding
- No significant life stage after reproduction in this wild population
- Population
- Not reported in this record
- Limit
- Population-growth sensitivity range 0.002-0.008; one population
- Verification
- Verified against primary full text
- Source location
- Table 1; Methods 2.2-2.5
- Verification date
- Checked 2026-09-29
Wild result: no significant post-reproductive stage
Japanese macaque (wild)
Macaca fuscata
- Measures
0.5% of adult life-years (demographic PrR)
Ovary-based Phys-PrR: Not reported in this record
Age M (95% of summed age-specific fertility): 14 years
- Finding
- No significant life stage after reproduction in this wild population
- Population
- Not reported in this record
- Limit
- One population; values from different studies use different data periods
- Verification
- Verified against primary full text
- Source location
- Table 1; Methods 2.2-2.5
- Verification date
- Checked 2026-09-29
Wild result: no significant post-reproductive stage
Antarctic fur seal
Arctocephalus gazella
- Measures
0.4% of adult life-years (demographic PrR)
Ovary-based Phys-PrR: Not reported in this record
Age M (95% of summed age-specific fertility): 17 years
- Published scenario range
0.1%–0.6% demographic PrR. These are not confidence intervals.
Metric notes
Demographic PrR: estimated post-reproductive adult female life-years / all adult female life-years; not a percentage of females. B and M definitions follow the source. Ellis 2018 uses first observed reproduction for age B; M is 95% of summed age-specific fecundity, independent of mortality. Table 1 values used consistently; prose differs for humans and orcas. Scenario endpoints are sensitivity results under alternative population growth assumptions, not confidence limits.
- Finding
- No significant life stage after reproduction in this wild population
- Population
- Not reported in this record
- Limit
- Population-growth sensitivity range 0.001-0.006; one population
- Verification
- Verified against primary full text
- Source location
- Table 1; Methods 2.2-2.5
- Verification date
- Checked 2026-09-29
Wild result: no significant post-reproductive stage
Bighorn sheep
Ovis canadensis
- Measures
0.4% of adult life-years (demographic PrR)
Ovary-based Phys-PrR: Not reported in this record
Age M (95% of summed age-specific fertility): 16 years
- Finding
- No significant life stage after reproduction in this wild population
- Population
- Not reported in this record
- Limit
- One population; values from different studies use different data periods
- Verification
- Verified against primary full text
- Source location
- Table 1; Methods 2.2-2.5
- Verification date
- Checked 2026-09-29
Wild result: no significant post-reproductive stage
European badger
Meles meles
- Measures
0.4% of adult life-years (demographic PrR)
Ovary-based Phys-PrR: Not reported in this record
Age M (95% of summed age-specific fertility): 12 years
- Finding
- No significant life stage after reproduction in this wild population
- Population
- Not reported in this record
- Limit
- One population; values from different studies use different data periods
- Verification
- Verified against primary full text
- Source location
- Table 1; Methods 2.2-2.5
- Verification date
- Checked 2026-09-29
Wild result: no significant post-reproductive stage
Lion
Panthera leo
- Measures
0.4% of adult life-years (demographic PrR)
Ovary-based Phys-PrR: Not reported in this record
Age M (95% of summed age-specific fertility): 15 years
- Finding
- No significant life stage after reproduction in this wild population
- Population
- Not reported in this record
- Limit
- One population; values from different studies use different data periods
- Verification
- Verified against primary full text
- Source location
- Table 1; Methods 2.2-2.5
- Verification date
- Checked 2026-09-29
Wild result: no significant post-reproductive stage
Meerkat
Suricata suricatta
- Measures
0.4% of adult life-years (demographic PrR)
Ovary-based Phys-PrR: Not reported in this record
Age M (95% of summed age-specific fertility): 12 years
- Published scenario range
0.2%–0.8% demographic PrR. These are not confidence intervals.
Metric notes
Demographic PrR: estimated post-reproductive adult female life-years / all adult female life-years; not a percentage of females. B and M definitions follow the source. Ellis 2018 uses first observed reproduction for age B; M is 95% of summed age-specific fecundity, independent of mortality. Table 1 values used consistently; prose differs for humans and orcas. Scenario endpoints are sensitivity results under alternative population growth assumptions, not confidence limits.
- Finding
- No significant life stage after reproduction in this wild population
- Population
- Not reported in this record
- Limit
- Population-growth sensitivity range 0.002-0.008; one population
- Verification
- Verified against primary full text
- Source location
- Table 1; Methods 2.2-2.5
- Verification date
- Checked 2026-09-29
Wild result: no significant post-reproductive stage
Raccoon
Procyon lotor
- Measures
0.4% of adult life-years (demographic PrR)
Ovary-based Phys-PrR: Not reported in this record
Age M (95% of summed age-specific fertility): 12 years
- Published scenario range
0.2%–0.5% demographic PrR. These are not confidence intervals.
Metric notes
Demographic PrR: estimated post-reproductive adult female life-years / all adult female life-years; not a percentage of females. B and M definitions follow the source. Ellis 2018 uses first observed reproduction for age B; M is 95% of summed age-specific fecundity, independent of mortality. Table 1 values used consistently; prose differs for humans and orcas. Scenario endpoints are sensitivity results under alternative population growth assumptions, not confidence limits.
- Finding
- No significant life stage after reproduction in this wild population
- Population
- Not reported in this record
- Limit
- Population-growth sensitivity range 0.002-0.005; one population
- Verification
- Verified against primary full text
- Source location
- Table 1; Methods 2.2-2.5
- Verification date
- Checked 2026-09-29
Wild result: no significant post-reproductive stage
White-headed capuchin
Cebus capucinus
- Measures
0.4% of adult life-years (demographic PrR)
Ovary-based Phys-PrR: Not reported in this record
Age M (95% of summed age-specific fertility): 25 years
- Finding
- No significant life stage after reproduction in this wild population
- Population
- Not reported in this record
- Limit
- One population; values from different studies use different data periods
- Verification
- Verified against primary full text
- Source location
- Table 1; Methods 2.2-2.5
- Verification date
- Checked 2026-09-29
Wild result: no significant post-reproductive stage
Cheetah
Acinonyx jubatus
- Measures
0.3% of adult life-years (demographic PrR)
Ovary-based Phys-PrR: Not reported in this record
Age M (95% of summed age-specific fertility): 12 years
- Finding
- No significant life stage after reproduction in this wild population
- Population
- Not reported in this record
- Limit
- One population; values from different studies use different data periods
- Verification
- Verified against primary full text
- Source location
- Table 1; Methods 2.2-2.5
- Verification date
- Checked 2026-09-29
Wild result: no significant post-reproductive stage
Himalayan tahr
Hemitragus jemlahicus
- Measures
0.3% of adult life-years (demographic PrR)
Ovary-based Phys-PrR: Not reported in this record
Age M (95% of summed age-specific fertility): 16 years
- Published scenario range
0.1%–0.3% demographic PrR. These are not confidence intervals.
Metric notes
Demographic PrR: estimated post-reproductive adult female life-years / all adult female life-years; not a percentage of females. B and M definitions follow the source. Ellis 2018 uses first observed reproduction for age B; M is 95% of summed age-specific fecundity, independent of mortality. Table 1 values used consistently; prose differs for humans and orcas. Scenario endpoints are sensitivity results under alternative population growth assumptions, not confidence limits.
- Finding
- No significant life stage after reproduction in this wild population
- Population
- Not reported in this record
- Limit
- Population-growth sensitivity range 0.001-0.003; one population Study population was predator-free.
- Verification
- Verified against primary full text
- Source location
- Table 1; Methods 2.2-2.5
- Verification date
- Checked 2026-09-29
Wild result: no significant post-reproductive stage
Lechwe
Kobus leche
- Measures
0.3% of adult life-years (demographic PrR)
Ovary-based Phys-PrR: Not reported in this record
Age M (95% of summed age-specific fertility): 11 years
- Published scenario range
0.2%–0.6% demographic PrR. These are not confidence intervals.
Metric notes
Demographic PrR: estimated post-reproductive adult female life-years / all adult female life-years; not a percentage of females. B and M definitions follow the source. Ellis 2018 uses first observed reproduction for age B; M is 95% of summed age-specific fecundity, independent of mortality. Table 1 values used consistently; prose differs for humans and orcas. Scenario endpoints are sensitivity results under alternative population growth assumptions, not confidence limits.
- Finding
- No significant life stage after reproduction in this wild population
- Population
- Not reported in this record
- Limit
- Population-growth sensitivity range 0.002-0.006; one population
- Verification
- Verified against primary full text
- Source location
- Table 1; Methods 2.2-2.5
- Verification date
- Checked 2026-09-29
Wild result: no significant post-reproductive stage
North American beaver
Castor canadensis
- Measures
0.3% of adult life-years (demographic PrR)
Ovary-based Phys-PrR: Not reported in this record
Age M (95% of summed age-specific fertility): 13 years
- Published scenario range
0.2%–0.7% demographic PrR. These are not confidence intervals.
Metric notes
Demographic PrR: estimated post-reproductive adult female life-years / all adult female life-years; not a percentage of females. B and M definitions follow the source. Ellis 2018 uses first observed reproduction for age B; M is 95% of summed age-specific fecundity, independent of mortality. Table 1 values used consistently; prose differs for humans and orcas. Scenario endpoints are sensitivity results under alternative population growth assumptions, not confidence limits.
- Finding
- No significant life stage after reproduction in this wild population
- Population
- Not reported in this record
- Limit
- Population-growth sensitivity range 0.002-0.007; one population
- Verification
- Verified against primary full text
- Source location
- Table 1; Methods 2.2-2.5
- Verification date
- Checked 2026-09-29
Wild result: no significant post-reproductive stage
Verreaux's sifaka
Propithecus verreauxi
- Measures
0.3% of adult life-years (demographic PrR)
Ovary-based Phys-PrR: Not reported in this record
Age M (95% of summed age-specific fertility): 30 years
- Finding
- No significant life stage after reproduction in this wild population
- Population
- Not reported in this record
- Limit
- One population; values from different studies use different data periods
- Verification
- Verified against primary full text
- Source location
- Table 1; Methods 2.2-2.5
- Verification date
- Checked 2026-09-29
Wild result: no significant post-reproductive stage
Arctic fox
Vulpes lagopus
- Measures
0.2% of adult life-years (demographic PrR)
Ovary-based Phys-PrR: Not reported in this record
Age M (95% of summed age-specific fertility): 10 years
- Published scenario range
0.1%–0.3% demographic PrR. These are not confidence intervals.
Metric notes
Demographic PrR: estimated post-reproductive adult female life-years / all adult female life-years; not a percentage of females. B and M definitions follow the source. Ellis 2018 uses first observed reproduction for age B; M is 95% of summed age-specific fecundity, independent of mortality. Table 1 values used consistently; prose differs for humans and orcas. Scenario endpoints are sensitivity results under alternative population growth assumptions, not confidence limits.
- Finding
- No significant life stage after reproduction in this wild population
- Population
- Not reported in this record
- Limit
- Population-growth sensitivity range 0.001-0.003; one population
- Verification
- Verified against primary full text
- Source location
- Table 1; Methods 2.2-2.5
- Verification date
- Checked 2026-09-29
Wild result: no significant post-reproductive stage
Australian fur seal
Arctocephalus pusillus
- Measures
0.2% of adult life-years (demographic PrR)
Ovary-based Phys-PrR: Not reported in this record
Age M (95% of summed age-specific fertility): 20 years
- Published scenario range
0.1%–0.3% demographic PrR. These are not confidence intervals.
Metric notes
Demographic PrR: estimated post-reproductive adult female life-years / all adult female life-years; not a percentage of females. B and M definitions follow the source. Ellis 2018 uses first observed reproduction for age B; M is 95% of summed age-specific fecundity, independent of mortality. Table 1 values used consistently; prose differs for humans and orcas. Scenario endpoints are sensitivity results under alternative population growth assumptions, not confidence limits.
- Finding
- No significant life stage after reproduction in this wild population
- Population
- Not reported in this record
- Limit
- Population-growth sensitivity range 0.001-0.003; one population
- Verification
- Verified against primary full text
- Source location
- Table 1; Methods 2.2-2.5
- Verification date
- Checked 2026-09-29
Wild result: no significant post-reproductive stage
Brown bear
Ursus arctos
- Measures
0.2% of adult life-years (demographic PrR)
Ovary-based Phys-PrR: Not reported in this record
Age M (95% of summed age-specific fertility): 30 years
- Published scenario range
0%–0.3% demographic PrR. These are not confidence intervals.
Metric notes
Demographic PrR: estimated post-reproductive adult female life-years / all adult female life-years; not a percentage of females. B and M definitions follow the source. Ellis 2018 uses first observed reproduction for age B; M is 95% of summed age-specific fecundity, independent of mortality. Table 1 values used consistently; prose differs for humans and orcas. Scenario endpoints are sensitivity results under alternative population growth assumptions, not confidence limits.
- Finding
- No significant life stage after reproduction in this wild population
- Population
- Not reported in this record
- Limit
- Population-growth sensitivity range 0-0.003; one population
- Verification
- Verified against primary full text
- Source location
- Table 1; Methods 2.2-2.5
- Verification date
- Checked 2026-09-29
Wild result: no significant post-reproductive stage
Long-finned pilot whale
Globicephala melas
- Measures
0.2% of adult life-years (demographic PrR)
Ovary-based Phys-PrR: Not reported in this record
Age M (95% of summed age-specific fertility): 57 years
- Published scenario range
0%–0.2% demographic PrR. These are not confidence intervals.
Metric notes
Demographic PrR: estimated post-reproductive adult female life-years / all adult female life-years; not a percentage of females. B and M definitions follow the source. Ellis 2018 uses first observed reproduction for age B; M is 95% of summed age-specific fecundity, independent of mortality. Table 1 values used consistently; prose differs for humans and orcas. Scenario endpoints are sensitivity results under alternative population growth assumptions, not confidence limits.
- Finding
- No significant life stage after reproduction in this wild population
- Population
- Not reported in this record
- Limit
- Population-growth sensitivity range 0-0.002; one population
- Verification
- Verified against primary full text
- Source location
- Table 1; Methods 2.2-2.5
- Verification date
- Checked 2026-09-29
Wild result: no significant post-reproductive stage
Northern fur seal
Callorhinus ursinus
- Measures
0.2% of adult life-years (demographic PrR)
Ovary-based Phys-PrR: Not reported in this record
Age M (95% of summed age-specific fertility): 21 years
- Published scenario range
0%–0.2% demographic PrR. These are not confidence intervals.
Metric notes
Demographic PrR: estimated post-reproductive adult female life-years / all adult female life-years; not a percentage of females. B and M definitions follow the source. Ellis 2018 uses first observed reproduction for age B; M is 95% of summed age-specific fecundity, independent of mortality. Table 1 values used consistently; prose differs for humans and orcas. Scenario endpoints are sensitivity results under alternative population growth assumptions, not confidence limits.
- Finding
- No significant life stage after reproduction in this wild population
- Population
- Not reported in this record
- Limit
- Population-growth sensitivity range 0-0.002; one population
- Verification
- Verified against primary full text
- Source location
- Table 1; Methods 2.2-2.5
- Verification date
- Checked 2026-09-29
Wild result: no significant post-reproductive stage
Belding's ground squirrel
Urocitellus beldingi
- Measures
0.1% of adult life-years (demographic PrR)
Ovary-based Phys-PrR: Not reported in this record
Age M (95% of summed age-specific fertility): 8 years
- Finding
- No significant life stage after reproduction in this wild population
- Population
- Not reported in this record
- Limit
- One population; values from different studies use different data periods
- Verification
- Verified against primary full text
- Source location
- Table 1; Methods 2.2-2.5
- Verification date
- Checked 2026-09-29
Wild result: no significant post-reproductive stage
Pyrenean chamois
Rupicapra pyrenaica
- Measures
0.1% of adult life-years (demographic PrR)
Ovary-based Phys-PrR: Not reported in this record
Age M (95% of summed age-specific fertility): 11 years
- Published scenario range
0.1%–0.1% demographic PrR. These are not confidence intervals.
Metric notes
Demographic PrR: estimated post-reproductive adult female life-years / all adult female life-years; not a percentage of females. B and M definitions follow the source. Ellis 2018 uses first observed reproduction for age B; M is 95% of summed age-specific fecundity, independent of mortality. Table 1 values used consistently; prose differs for humans and orcas. Scenario endpoints are sensitivity results under alternative population growth assumptions, not confidence limits.
- Finding
- No significant life stage after reproduction in this wild population
- Population
- Not reported in this record
- Limit
- Population-growth sensitivity range 0.001-0.001; one population Study population was predator-free.
- Verification
- Verified against primary full text
- Source location
- Table 1; Methods 2.2-2.5
- Verification date
- Checked 2026-09-29
Wild result: no significant post-reproductive stage
Red deer
Cervus elaphus
- Measures
0.1% of adult life-years (demographic PrR)
Ovary-based Phys-PrR: Not reported in this record
Age M (95% of summed age-specific fertility): 17 years
- Finding
- No significant life stage after reproduction in this wild population
- Population
- Not reported in this record
- Limit
- One population; values from different studies use different data periods Study population was predator-free.
- Verification
- Verified against primary full text
- Source location
- Table 1; Methods 2.2-2.5
- Verification date
- Checked 2026-09-29
Wild result: no significant post-reproductive stage
Reindeer
Rangifer tarandus
- Measures
0.1% of adult life-years (demographic PrR)
Ovary-based Phys-PrR: Not reported in this record
Age M (95% of summed age-specific fertility): 16 years
- Published scenario range
0%–0.2% demographic PrR. These are not confidence intervals.
Metric notes
Demographic PrR: estimated post-reproductive adult female life-years / all adult female life-years; not a percentage of females. B and M definitions follow the source. Ellis 2018 uses first observed reproduction for age B; M is 95% of summed age-specific fecundity, independent of mortality. Table 1 values used consistently; prose differs for humans and orcas. Scenario endpoints are sensitivity results under alternative population growth assumptions, not confidence limits.
- Finding
- No significant life stage after reproduction in this wild population
- Population
- Not reported in this record
- Limit
- Population-growth sensitivity range 0-0.002; one population
- Verification
- Verified against primary full text
- Source location
- Table 1; Methods 2.2-2.5
- Verification date
- Checked 2026-09-29
Wild result: no significant post-reproductive stage
Ring-tailed lemur
Lemur catta
- Measures
0.1% of adult life-years (demographic PrR)
Ovary-based Phys-PrR: Not reported in this record
Age M (95% of summed age-specific fertility): 16 years
- Finding
- No significant life stage after reproduction in this wild population
- Population
- Not reported in this record
- Limit
- One population; values from different studies use different data periods
- Verification
- Verified against primary full text
- Source location
- Table 1; Methods 2.2-2.5
- Verification date
- Checked 2026-09-29
Wild result: no significant post-reproductive stage
Soay sheep
Ovis aries
- Measures
0.1% of adult life-years (demographic PrR)
Ovary-based Phys-PrR: Not reported in this record
Age M (95% of summed age-specific fertility): 13 years
- Finding
- No significant life stage after reproduction in this wild population
- Population
- Not reported in this record
- Limit
- One population; values from different studies use different data periods
- Verification
- Verified against primary full text
- Source location
- Table 1; Methods 2.2-2.5
- Verification date
- Checked 2026-09-29
Wild result: no significant post-reproductive stage
Weddell seal
Leptonychotes weddellii
- Measures
0.1% of adult life-years (demographic PrR)
Ovary-based Phys-PrR: Not reported in this record
Age M (95% of summed age-specific fertility): 17 years
- Published scenario range
0%–0.2% demographic PrR. These are not confidence intervals.
Metric notes
Demographic PrR: estimated post-reproductive adult female life-years / all adult female life-years; not a percentage of females. B and M definitions follow the source. Ellis 2018 uses first observed reproduction for age B; M is 95% of summed age-specific fecundity, independent of mortality. Table 1 values used consistently; prose differs for humans and orcas. Scenario endpoints are sensitivity results under alternative population growth assumptions, not confidence limits.
- Finding
- No significant life stage after reproduction in this wild population
- Population
- Not reported in this record
- Limit
- Population-growth sensitivity range 0-0.002; one population
- Verification
- Verified against primary full text
- Source location
- Table 1; Methods 2.2-2.5
- Verification date
- Checked 2026-09-29
Wild result: no significant post-reproductive stage
American red squirrel
Tamiasciurus hudsonicus
- Measures
0.0% of adult life-years (demographic PrR)
Ovary-based Phys-PrR: Not reported in this record
Age M (95% of summed age-specific fertility): 8 years
- Finding
- No significant life stage after reproduction in this wild population
- Population
- Not reported in this record
- Limit
- One population; values from different studies use different data periods
- Verification
- Verified against primary full text
- Source location
- Table 1; Methods 2.2-2.5
- Verification date
- Checked 2026-09-29
Wild result: no significant post-reproductive stage
Banded mongoose
Mungos mungo
- Measures
0.0% of adult life-years (demographic PrR)
Ovary-based Phys-PrR: Not reported in this record
Age M (95% of summed age-specific fertility): 10 years
- Finding
- No significant life stage after reproduction in this wild population
- Population
- Not reported in this record
- Limit
- One population; values from different studies use different data periods
- Verification
- Verified against primary full text
- Source location
- Table 1; Methods 2.2-2.5
- Verification date
- Checked 2026-09-29
Wild result: no significant post-reproductive stage
Golden-mantled ground squirrel
Callospermophilus lateralis
- Measures
0.0% of adult life-years (demographic PrR)
Ovary-based Phys-PrR: Not reported in this record
Age M (95% of summed age-specific fertility): 7 years
- Published scenario range
0%–0% demographic PrR. These are not confidence intervals.
Metric notes
Demographic PrR: estimated post-reproductive adult female life-years / all adult female life-years; not a percentage of females. B and M definitions follow the source. Ellis 2018 uses first observed reproduction for age B; M is 95% of summed age-specific fecundity, independent of mortality. Table 1 values used consistently; prose differs for humans and orcas. Scenario endpoints are sensitivity results under alternative population growth assumptions, not confidence limits.
- Finding
- No significant life stage after reproduction in this wild population
- Population
- Not reported in this record
- Limit
- Population-growth sensitivity range 0-0; one population
- Verification
- Verified against primary full text
- Source location
- Table 1; Methods 2.2-2.5
- Verification date
- Checked 2026-09-29
Wild result: no significant post-reproductive stage
Hawaiian monk seal
Monachus schauinslandi
- Measures
0.0% of adult life-years (demographic PrR)
Ovary-based Phys-PrR: Not reported in this record
Age M (95% of summed age-specific fertility): 28 years
- Finding
- No significant life stage after reproduction in this wild population
- Population
- Not reported in this record
- Limit
- One population; values from different studies use different data periods
- Verification
- Verified against primary full text
- Source location
- Table 1; Methods 2.2-2.5
- Verification date
- Checked 2026-09-29
Wild result: no significant post-reproductive stage
Japanese serow
Capricornis crispus
- Measures
0.0% of adult life-years (demographic PrR)
Ovary-based Phys-PrR: Not reported in this record
Age M (95% of summed age-specific fertility): 20 years
- Published scenario range
0%–0% demographic PrR. These are not confidence intervals.
Metric notes
Demographic PrR: estimated post-reproductive adult female life-years / all adult female life-years; not a percentage of females. B and M definitions follow the source. Ellis 2018 uses first observed reproduction for age B; M is 95% of summed age-specific fecundity, independent of mortality. Table 1 values used consistently; prose differs for humans and orcas. Scenario endpoints are sensitivity results under alternative population growth assumptions, not confidence limits.
- Finding
- No significant life stage after reproduction in this wild population
- Population
- Not reported in this record
- Limit
- Population-growth sensitivity range 0-0; one population
- Verification
- Verified against primary full text
- Source location
- Table 1; Methods 2.2-2.5
- Verification date
- Checked 2026-09-29
Wild result: no significant post-reproductive stage
Long-finned pilot whale (genetic study)
Globicephala melas
- Measures
Demographic PrR: Not reported in this record
Ovary-based Phys-PrR: Not reported in this record
Age M: Not reported in this record
- Finding
- Genetic study of a species lacking a widespread post-reproductive lifespan; females with many adult daughters were less likely to breed.
- Population
- 1,522 individuals in 22 pods
- Limit
- Individual females may still stop; not the same as no one ever stopping
- Verification
- Verified Primary Abstract
- Source location
- Publisher abstract; online January 7, 2020
- Verification date
- Checked 2026-09-29
Heat cycles can continue through life
Domestic dog
Canis familiaris
- Measures
Demographic PrR: Not reported in this record
Ovary-based Phys-PrR: Not reported in this record
Age M: Not reported in this record
- Finding
- Most unspayed females continue heat cycles through life; gaps may grow with age.
- Population
- Not reported in this record
- Limit
- Veterinary review, not a population prevalence study. Infertility can occur; ask a veterinarian about an individual dog. Numerical cycle-gap range omitted because its original measurement was not checked.
- Verification
- Verified Veterinary Review
- Source location
- Observations: Reproductive aging in female dogs
- Verification date
- Checked 2026-09-29
Heat cycles can continue through life
Domestic cat
Felis catus
- Measures
Demographic PrR: Not reported in this record
Ovary-based Phys-PrR: Not reported in this record
Age M: Not reported in this record
- Finding
- Veterinary guidance says unspayed cats do not have a normal human-like menopause; older cats may still become pregnant.
- Population
- Not reported in this record
- Limit
- Primary clinic guidance, not a species-wide physiological study; it does not guarantee fertility in every older cat.
- Verification
- Verified Veterinary Guidance
- Source location
- Section stating cats do not undergo menopause
- Verification date
- Checked 2026-09-29
Menopause-like stage in an insect
Japanese gall aphid
Quadrartus yoshinomiyai
- Measures
Demographic PrR: Not reported in this record
Ovary-based Phys-PrR: Not reported in this record
Age M: Not reported in this record
- Finding
- Older wingless females stop reproducing, then defend the colony by gluing themselves to predators with wax
- Population
- Not reported in this record
- Limit
- An insect life stage, not mammal menopause
- Verification
- Verified Primary Abstract
- Source location
- Original abstract, author institution record
- Verification date
- Checked 2026-09-29
Humans, for comparison
Human (Hadza hunter-gatherers, Tanzania)
Homo sapiens
- Measures
44.3% of adult life-years (demographic PrR)
Ovary-based Phys-PrR: Not reported in this record
Age M (95% of summed age-specific fertility): 41 years
- Finding
- Women live a large share of adult life after reproduction ends
- Population
- Not reported in this record
- Limit
- One population; values from different studies use different data periods
- Verification
- Verified against primary full text
- Source location
- Table 1; Methods 2.2-2.5
- Verification date
- Checked 2026-09-29
Humans, for comparison
Human (Ache hunter-gatherers, Paraguay)
Homo sapiens
- Measures
43.9% of adult life-years (demographic PrR)
Ovary-based Phys-PrR: Not reported in this record
Age M (95% of summed age-specific fertility): 44 years
- Finding
- Women live a large share of adult life after reproduction ends
- Population
- Not reported in this record
- Limit
- Published life-table estimate, not current population statistics; original individual observations were not reanalyzed.
- Source
- Levitis, Burger and Lackey 2013, Evolutionary Anthropology 22:66-79, Table 1 Read-through source
- Verification
- Verified against primary full text
- Source location
- Table 1; Box 1
- Verification date
- Checked 2026-09-29
Humans, for comparison
Human (!Kung hunter-gatherers, Botswana)
Homo sapiens
- Measures
42.5% of adult life-years (demographic PrR)
Ovary-based Phys-PrR: Not reported in this record
Age M (95% of summed age-specific fertility): 42 years
- Finding
- Women live a large share of adult life after reproduction ends
- Population
- Not reported in this record
- Limit
- Uses the directly checked 2013 Table 1 estimate (0.425), not the 2011 estimate (0.426) reproduced in Wood 2023. Not current population statistics.
- Source
- Levitis, Burger and Lackey 2013, Evolutionary Anthropology 22:66-79, Table 1 Read-through source
- Verification
- Verified against primary full text
- Source location
- Table 1; Box 1
- Verification date
- Checked 2026-09-29
Full 76-record evidence ledger
| record_id | common_name | scientific_name | animal_group | setting | evidence_level | evidence_type | prr | prr_pct_adult_life | prr_significant | age_m_95pct_fertility | sample | finding | limit | source | source_url | source_year | checked_on | phys_prr | phys_prr_pct_adult_life | scenario_low | scenario_high | scenario_metric | metric_notes | source_locator | source_read_url | verification_status | secondary_source_url |
|---|---|---|---|---|---|---|---|---|---|---|---|---|---|---|---|---|---|---|---|---|---|---|---|---|---|---|---|
| AMP-001 | African elephant | Loxodonta africana | Elephant | wild | tested_wild_not_found | life table (PrR) | 0.035 | 3.5 | no | 59 | — | No significant life stage after reproduction in this wild population | One population; values from different studies use different data periods | Ellis et al. 2018, Ecology and Evolution 8:2482-2494, Table 1 | https://pmc.ncbi.nlm.nih.gov/articles/PMC5838047/ | 2018 | 2026-09-29 | — | — | — | — | — | Demographic PrR: estimated post-reproductive adult female life-years / all adult female life-years; not a percentage of females. B and M definitions follow the source. Ellis 2018 uses first observed reproduction for age B; M is 95% of summed age-specific fecundity, independent of mortality. Table 1 values used consistently; prose differs for humans and orcas. | Table 1; Methods 2.2-2.5 | https://pmc.ncbi.nlm.nih.gov/articles/PMC5838047/table/ece33856-tbl-0001/ | verified_primary_full_text | — |
| AMP-002 | American bison | Bison bison | Hoofed mammal | wild | tested_wild_not_found | life table (PrR) | 0.029 | 2.9 | no | 17 | — | No significant life stage after reproduction in this wild population | Population-growth sensitivity range 0.009-0.048; one population | Ellis et al. 2018, Ecology and Evolution 8:2482-2494, Table 1 | https://pmc.ncbi.nlm.nih.gov/articles/PMC5838047/ | 2018 | 2026-09-29 | — | — | 0.009 | 0.048 | demographic_prr | Demographic PrR: estimated post-reproductive adult female life-years / all adult female life-years; not a percentage of females. B and M definitions follow the source. Ellis 2018 uses first observed reproduction for age B; M is 95% of summed age-specific fecundity, independent of mortality. Table 1 values used consistently; prose differs for humans and orcas. Scenario endpoints are sensitivity results under alternative population growth assumptions, not confidence limits. | Table 1; Methods 2.2-2.5 | https://pmc.ncbi.nlm.nih.gov/articles/PMC5838047/table/ece33856-tbl-0001/ | verified_primary_full_text | — |
| AMP-003 | American red squirrel | Tamiasciurus hudsonicus | Rodent | wild | tested_wild_not_found | life table (PrR) | 0.000 | 0.0 | no | 8 | — | No significant life stage after reproduction in this wild population | One population; values from different studies use different data periods | Ellis et al. 2018, Ecology and Evolution 8:2482-2494, Table 1 | https://pmc.ncbi.nlm.nih.gov/articles/PMC5838047/ | 2018 | 2026-09-29 | — | — | — | — | — | Demographic PrR: estimated post-reproductive adult female life-years / all adult female life-years; not a percentage of females. B and M definitions follow the source. Ellis 2018 uses first observed reproduction for age B; M is 95% of summed age-specific fecundity, independent of mortality. Table 1 values used consistently; prose differs for humans and orcas. | Table 1; Methods 2.2-2.5 | https://pmc.ncbi.nlm.nih.gov/articles/PMC5838047/table/ece33856-tbl-0001/ | verified_primary_full_text | — |
| AMP-004 | Antarctic fur seal | Arctocephalus gazella | Seal or sea lion | wild | tested_wild_not_found | life table (PrR) | 0.004 | 0.4 | no | 17 | — | No significant life stage after reproduction in this wild population | Population-growth sensitivity range 0.001-0.006; one population | Ellis et al. 2018, Ecology and Evolution 8:2482-2494, Table 1 | https://pmc.ncbi.nlm.nih.gov/articles/PMC5838047/ | 2018 | 2026-09-29 | — | — | 0.001 | 0.006 | demographic_prr | Demographic PrR: estimated post-reproductive adult female life-years / all adult female life-years; not a percentage of females. B and M definitions follow the source. Ellis 2018 uses first observed reproduction for age B; M is 95% of summed age-specific fecundity, independent of mortality. Table 1 values used consistently; prose differs for humans and orcas. Scenario endpoints are sensitivity results under alternative population growth assumptions, not confidence limits. | Table 1; Methods 2.2-2.5 | https://pmc.ncbi.nlm.nih.gov/articles/PMC5838047/table/ece33856-tbl-0001/ | verified_primary_full_text | — |
| AMP-005 | Arctic fox | Vulpes lagopus | Carnivore | wild | tested_wild_not_found | life table (PrR) | 0.002 | 0.2 | no | 10 | — | No significant life stage after reproduction in this wild population | Population-growth sensitivity range 0.001-0.003; one population | Ellis et al. 2018, Ecology and Evolution 8:2482-2494, Table 1 | https://pmc.ncbi.nlm.nih.gov/articles/PMC5838047/ | 2018 | 2026-09-29 | — | — | 0.001 | 0.003 | demographic_prr | Demographic PrR: estimated post-reproductive adult female life-years / all adult female life-years; not a percentage of females. B and M definitions follow the source. Ellis 2018 uses first observed reproduction for age B; M is 95% of summed age-specific fecundity, independent of mortality. Table 1 values used consistently; prose differs for humans and orcas. Scenario endpoints are sensitivity results under alternative population growth assumptions, not confidence limits. | Table 1; Methods 2.2-2.5 | https://pmc.ncbi.nlm.nih.gov/articles/PMC5838047/table/ece33856-tbl-0001/ | verified_primary_full_text | — |
| AMP-006 | Australian fur seal | Arctocephalus pusillus | Seal or sea lion | wild | tested_wild_not_found | life table (PrR) | 0.002 | 0.2 | no | 20 | — | No significant life stage after reproduction in this wild population | Population-growth sensitivity range 0.001-0.003; one population | Ellis et al. 2018, Ecology and Evolution 8:2482-2494, Table 1 | https://pmc.ncbi.nlm.nih.gov/articles/PMC5838047/ | 2018 | 2026-09-29 | — | — | 0.001 | 0.003 | demographic_prr | Demographic PrR: estimated post-reproductive adult female life-years / all adult female life-years; not a percentage of females. B and M definitions follow the source. Ellis 2018 uses first observed reproduction for age B; M is 95% of summed age-specific fecundity, independent of mortality. Table 1 values used consistently; prose differs for humans and orcas. Scenario endpoints are sensitivity results under alternative population growth assumptions, not confidence limits. | Table 1; Methods 2.2-2.5 | https://pmc.ncbi.nlm.nih.gov/articles/PMC5838047/table/ece33856-tbl-0001/ | verified_primary_full_text | — |
| AMP-007 | Banded mongoose | Mungos mungo | Carnivore | wild | tested_wild_not_found | life table (PrR) | 0.000 | 0.0 | no | 10 | — | No significant life stage after reproduction in this wild population | One population; values from different studies use different data periods | Ellis et al. 2018, Ecology and Evolution 8:2482-2494, Table 1 | https://pmc.ncbi.nlm.nih.gov/articles/PMC5838047/ | 2018 | 2026-09-29 | — | — | — | — | — | Demographic PrR: estimated post-reproductive adult female life-years / all adult female life-years; not a percentage of females. B and M definitions follow the source. Ellis 2018 uses first observed reproduction for age B; M is 95% of summed age-specific fecundity, independent of mortality. Table 1 values used consistently; prose differs for humans and orcas. | Table 1; Methods 2.2-2.5 | https://pmc.ncbi.nlm.nih.gov/articles/PMC5838047/table/ece33856-tbl-0001/ | verified_primary_full_text | — |
| AMP-008 | Belding's ground squirrel | Urocitellus beldingi | Rodent | wild | tested_wild_not_found | life table (PrR) | 0.001 | 0.1 | no | 8 | — | No significant life stage after reproduction in this wild population | One population; values from different studies use different data periods | Ellis et al. 2018, Ecology and Evolution 8:2482-2494, Table 1 | https://pmc.ncbi.nlm.nih.gov/articles/PMC5838047/ | 2018 | 2026-09-29 | — | — | — | — | — | Demographic PrR: estimated post-reproductive adult female life-years / all adult female life-years; not a percentage of females. B and M definitions follow the source. Ellis 2018 uses first observed reproduction for age B; M is 95% of summed age-specific fecundity, independent of mortality. Table 1 values used consistently; prose differs for humans and orcas. | Table 1; Methods 2.2-2.5 | https://pmc.ncbi.nlm.nih.gov/articles/PMC5838047/table/ece33856-tbl-0001/ | verified_primary_full_text | — |
| AMP-009 | Bighorn sheep | Ovis canadensis | Hoofed mammal | wild | tested_wild_not_found | life table (PrR) | 0.004 | 0.4 | no | 16 | — | No significant life stage after reproduction in this wild population | One population; values from different studies use different data periods | Ellis et al. 2018, Ecology and Evolution 8:2482-2494, Table 1 | https://pmc.ncbi.nlm.nih.gov/articles/PMC5838047/ | 2018 | 2026-09-29 | — | — | — | — | — | Demographic PrR: estimated post-reproductive adult female life-years / all adult female life-years; not a percentage of females. B and M definitions follow the source. Ellis 2018 uses first observed reproduction for age B; M is 95% of summed age-specific fecundity, independent of mortality. Table 1 values used consistently; prose differs for humans and orcas. | Table 1; Methods 2.2-2.5 | https://pmc.ncbi.nlm.nih.gov/articles/PMC5838047/table/ece33856-tbl-0001/ | verified_primary_full_text | — |
| AMP-010 | Blue monkey | Cercopithecus mitis | Primate | wild | tested_wild_not_found | life table (PrR) | 0.005 | 0.5 | no | 29 | — | No significant life stage after reproduction in this wild population | One population; values from different studies use different data periods | Ellis et al. 2018, Ecology and Evolution 8:2482-2494, Table 1 | https://pmc.ncbi.nlm.nih.gov/articles/PMC5838047/ | 2018 | 2026-09-29 | — | — | — | — | — | Demographic PrR: estimated post-reproductive adult female life-years / all adult female life-years; not a percentage of females. B and M definitions follow the source. Ellis 2018 uses first observed reproduction for age B; M is 95% of summed age-specific fecundity, independent of mortality. Table 1 values used consistently; prose differs for humans and orcas. | Table 1; Methods 2.2-2.5 | https://pmc.ncbi.nlm.nih.gov/articles/PMC5838047/table/ece33856-tbl-0001/ | verified_primary_full_text | — |
| AMP-011 | Brown bear | Ursus arctos | Carnivore | wild | tested_wild_not_found | life table (PrR) | 0.002 | 0.2 | no | 30 | — | No significant life stage after reproduction in this wild population | Population-growth sensitivity range 0-0.003; one population | Ellis et al. 2018, Ecology and Evolution 8:2482-2494, Table 1 | https://pmc.ncbi.nlm.nih.gov/articles/PMC5838047/ | 2018 | 2026-09-29 | — | — | 0 | 0.003 | demographic_prr | Demographic PrR: estimated post-reproductive adult female life-years / all adult female life-years; not a percentage of females. B and M definitions follow the source. Ellis 2018 uses first observed reproduction for age B; M is 95% of summed age-specific fecundity, independent of mortality. Table 1 values used consistently; prose differs for humans and orcas. Scenario endpoints are sensitivity results under alternative population growth assumptions, not confidence limits. | Table 1; Methods 2.2-2.5 | https://pmc.ncbi.nlm.nih.gov/articles/PMC5838047/table/ece33856-tbl-0001/ | verified_primary_full_text | — |
| AMP-012 | Cheetah | Acinonyx jubatus | Carnivore | wild | tested_wild_not_found | life table (PrR) | 0.003 | 0.3 | no | 12 | — | No significant life stage after reproduction in this wild population | One population; values from different studies use different data periods | Ellis et al. 2018, Ecology and Evolution 8:2482-2494, Table 1 | https://pmc.ncbi.nlm.nih.gov/articles/PMC5838047/ | 2018 | 2026-09-29 | — | — | — | — | — | Demographic PrR: estimated post-reproductive adult female life-years / all adult female life-years; not a percentage of females. B and M definitions follow the source. Ellis 2018 uses first observed reproduction for age B; M is 95% of summed age-specific fecundity, independent of mortality. Table 1 values used consistently; prose differs for humans and orcas. | Table 1; Methods 2.2-2.5 | https://pmc.ncbi.nlm.nih.gov/articles/PMC5838047/table/ece33856-tbl-0001/ | verified_primary_full_text | — |
| AMP-013 | Chimpanzee (Gombe, Tanzania) | Pan troglodytes | Primate | wild | tested_wild_not_found | life table (PrR) | 0.006 | 0.6 | no | 50 | — | No significant life stage after reproduction in this wild population | One population; values from different studies use different data periods | Ellis et al. 2018, Ecology and Evolution 8:2482-2494, Table 1 | https://pmc.ncbi.nlm.nih.gov/articles/PMC5838047/ | 2018 | 2026-09-29 | — | — | — | — | — | Demographic PrR: estimated post-reproductive adult female life-years / all adult female life-years; not a percentage of females. B and M definitions follow the source. Ellis 2018 uses first observed reproduction for age B; M is 95% of summed age-specific fecundity, independent of mortality. Table 1 values used consistently; prose differs for humans and orcas. | Table 1; Methods 2.2-2.5 | https://pmc.ncbi.nlm.nih.gov/articles/PMC5838047/table/ece33856-tbl-0001/ | verified_primary_full_text | — |
| AMP-014 | Collared peccary | Pecari tajacu | Hoofed mammal | wild | tested_wild_not_found | life table (PrR) | 0.005 | 0.5 | no | 15 | — | No significant life stage after reproduction in this wild population | Population-growth sensitivity range 0.002-0.008; one population | Ellis et al. 2018, Ecology and Evolution 8:2482-2494, Table 1 | https://pmc.ncbi.nlm.nih.gov/articles/PMC5838047/ | 2018 | 2026-09-29 | — | — | 0.002 | 0.008 | demographic_prr | Demographic PrR: estimated post-reproductive adult female life-years / all adult female life-years; not a percentage of females. B and M definitions follow the source. Ellis 2018 uses first observed reproduction for age B; M is 95% of summed age-specific fecundity, independent of mortality. Table 1 values used consistently; prose differs for humans and orcas. Scenario endpoints are sensitivity results under alternative population growth assumptions, not confidence limits. | Table 1; Methods 2.2-2.5 | https://pmc.ncbi.nlm.nih.gov/articles/PMC5838047/table/ece33856-tbl-0001/ | verified_primary_full_text | — |
| AMP-015 | Mountain gorilla (Rwanda) | Gorilla beringei | Primate | wild | tested_wild_not_found | life table (PrR) | 0.022 | 2.2 | no | 38 | — | No significant life stage after reproduction in this wild population | One population; values from different studies use different data periods | Ellis et al. 2018, Ecology and Evolution 8:2482-2494, Table 1 | https://pmc.ncbi.nlm.nih.gov/articles/PMC5838047/ | 2018 | 2026-09-29 | — | — | — | — | — | Demographic PrR: estimated post-reproductive adult female life-years / all adult female life-years; not a percentage of females. B and M definitions follow the source. Ellis 2018 uses first observed reproduction for age B; M is 95% of summed age-specific fecundity, independent of mortality. Table 1 values used consistently; prose differs for humans and orcas. | Table 1; Methods 2.2-2.5 | https://pmc.ncbi.nlm.nih.gov/articles/PMC5838047/table/ece33856-tbl-0001/ | verified_primary_full_text | — |
| AMP-016 | European badger | Meles meles | Carnivore | wild | tested_wild_not_found | life table (PrR) | 0.004 | 0.4 | no | 12 | — | No significant life stage after reproduction in this wild population | One population; values from different studies use different data periods | Ellis et al. 2018, Ecology and Evolution 8:2482-2494, Table 1 | https://pmc.ncbi.nlm.nih.gov/articles/PMC5838047/ | 2018 | 2026-09-29 | — | — | — | — | — | Demographic PrR: estimated post-reproductive adult female life-years / all adult female life-years; not a percentage of females. B and M definitions follow the source. Ellis 2018 uses first observed reproduction for age B; M is 95% of summed age-specific fecundity, independent of mortality. Table 1 values used consistently; prose differs for humans and orcas. | Table 1; Methods 2.2-2.5 | https://pmc.ncbi.nlm.nih.gov/articles/PMC5838047/table/ece33856-tbl-0001/ | verified_primary_full_text | — |
| AMP-017 | Fin whale | Balaenoptera physalus | Baleen whale | wild | tested_wild_not_found | life table (PrR) | 0.006 | 0.6 | no | 95 | — | No significant life stage after reproduction in this wild population | Population-growth sensitivity range 0-0.012; one population Historical whaling altered mortality; age 95 is the modeled M threshold, not a directly observed last birth. | Ellis et al. 2018, Ecology and Evolution 8:2482-2494, Table 1 | https://pmc.ncbi.nlm.nih.gov/articles/PMC5838047/ | 2018 | 2026-09-29 | — | — | 0 | 0.012 | demographic_prr | Demographic PrR: estimated post-reproductive adult female life-years / all adult female life-years; not a percentage of females. B and M definitions follow the source. Ellis 2018 uses first observed reproduction for age B; M is 95% of summed age-specific fecundity, independent of mortality. Table 1 values used consistently; prose differs for humans and orcas. Scenario endpoints are sensitivity results under alternative population growth assumptions, not confidence limits. | Table 1; Methods 2.2-2.5 | https://pmc.ncbi.nlm.nih.gov/articles/PMC5838047/table/ece33856-tbl-0001/ | verified_primary_full_text | — |
| AMP-018 | Golden-mantled ground squirrel | Callospermophilus lateralis | Rodent | wild | tested_wild_not_found | life table (PrR) | 0.000 | 0.0 | no | 7 | — | No significant life stage after reproduction in this wild population | Population-growth sensitivity range 0-0; one population | Ellis et al. 2018, Ecology and Evolution 8:2482-2494, Table 1 | https://pmc.ncbi.nlm.nih.gov/articles/PMC5838047/ | 2018 | 2026-09-29 | — | — | 0 | 0 | demographic_prr | Demographic PrR: estimated post-reproductive adult female life-years / all adult female life-years; not a percentage of females. B and M definitions follow the source. Ellis 2018 uses first observed reproduction for age B; M is 95% of summed age-specific fecundity, independent of mortality. Table 1 values used consistently; prose differs for humans and orcas. Scenario endpoints are sensitivity results under alternative population growth assumptions, not confidence limits. | Table 1; Methods 2.2-2.5 | https://pmc.ncbi.nlm.nih.gov/articles/PMC5838047/table/ece33856-tbl-0001/ | verified_primary_full_text | — |
| AMP-019 | Hawaiian monk seal | Monachus schauinslandi | Seal or sea lion | wild | tested_wild_not_found | life table (PrR) | 0.000 | 0.0 | no | 28 | — | No significant life stage after reproduction in this wild population | One population; values from different studies use different data periods | Ellis et al. 2018, Ecology and Evolution 8:2482-2494, Table 1 | https://pmc.ncbi.nlm.nih.gov/articles/PMC5838047/ | 2018 | 2026-09-29 | — | — | — | — | — | Demographic PrR: estimated post-reproductive adult female life-years / all adult female life-years; not a percentage of females. B and M definitions follow the source. Ellis 2018 uses first observed reproduction for age B; M is 95% of summed age-specific fecundity, independent of mortality. Table 1 values used consistently; prose differs for humans and orcas. | Table 1; Methods 2.2-2.5 | https://pmc.ncbi.nlm.nih.gov/articles/PMC5838047/table/ece33856-tbl-0001/ | verified_primary_full_text | — |
| AMP-020 | Himalayan tahr | Hemitragus jemlahicus | Hoofed mammal | wild | tested_wild_not_found | life table (PrR) | 0.003 | 0.3 | no | 16 | — | No significant life stage after reproduction in this wild population | Population-growth sensitivity range 0.001-0.003; one population Study population was predator-free. | Ellis et al. 2018, Ecology and Evolution 8:2482-2494, Table 1 | https://pmc.ncbi.nlm.nih.gov/articles/PMC5838047/ | 2018 | 2026-09-29 | — | — | 0.001 | 0.003 | demographic_prr | Demographic PrR: estimated post-reproductive adult female life-years / all adult female life-years; not a percentage of females. B and M definitions follow the source. Ellis 2018 uses first observed reproduction for age B; M is 95% of summed age-specific fecundity, independent of mortality. Table 1 values used consistently; prose differs for humans and orcas. Scenario endpoints are sensitivity results under alternative population growth assumptions, not confidence limits. | Table 1; Methods 2.2-2.5 | https://pmc.ncbi.nlm.nih.gov/articles/PMC5838047/table/ece33856-tbl-0001/ | verified_primary_full_text | — |
| AMP-021 | Hippopotamus | Hippopotamus amphibius | Hoofed mammal | wild | tested_wild_not_found | life table (PrR) | 0.009 | 0.9 | no | 41 | — | No significant life stage after reproduction in this wild population | One population; values from different studies use different data periods | Ellis et al. 2018, Ecology and Evolution 8:2482-2494, Table 1 | https://pmc.ncbi.nlm.nih.gov/articles/PMC5838047/ | 2018 | 2026-09-29 | — | — | — | — | — | Demographic PrR: estimated post-reproductive adult female life-years / all adult female life-years; not a percentage of females. B and M definitions follow the source. Ellis 2018 uses first observed reproduction for age B; M is 95% of summed age-specific fecundity, independent of mortality. Table 1 values used consistently; prose differs for humans and orcas. | Table 1; Methods 2.2-2.5 | https://pmc.ncbi.nlm.nih.gov/articles/PMC5838047/table/ece33856-tbl-0001/ | verified_primary_full_text | — |
| AMP-022 | Human (Hadza hunter-gatherers, Tanzania) | Homo sapiens | Human | wild | human_reference | life table (PrR) | 0.443 | 44.3 | yes | 41 | — | Women live a large share of adult life after reproduction ends | One population; values from different studies use different data periods | Ellis et al. 2018, Ecology and Evolution 8:2482-2494, Table 1 | https://pmc.ncbi.nlm.nih.gov/articles/PMC5838047/ | 2018 | 2026-09-29 | — | — | — | — | — | Demographic PrR: estimated post-reproductive adult female life-years / all adult female life-years; not a percentage of females. B and M definitions follow the source. Ellis 2018 uses first observed reproduction for age B; M is 95% of summed age-specific fecundity, independent of mortality. Table 1 values used consistently; prose differs for humans and orcas. | Table 1; Methods 2.2-2.5 | https://pmc.ncbi.nlm.nih.gov/articles/PMC5838047/table/ece33856-tbl-0001/ | verified_primary_full_text | — |
| AMP-023 | Japanese macaque (wild) | Macaca fuscata | Primate | wild | tested_wild_not_found | life table (PrR) | 0.005 | 0.5 | no | 14 | — | No significant life stage after reproduction in this wild population | One population; values from different studies use different data periods | Ellis et al. 2018, Ecology and Evolution 8:2482-2494, Table 1 | https://pmc.ncbi.nlm.nih.gov/articles/PMC5838047/ | 2018 | 2026-09-29 | — | — | — | — | — | Demographic PrR: estimated post-reproductive adult female life-years / all adult female life-years; not a percentage of females. B and M definitions follow the source. Ellis 2018 uses first observed reproduction for age B; M is 95% of summed age-specific fecundity, independent of mortality. Table 1 values used consistently; prose differs for humans and orcas. | Table 1; Methods 2.2-2.5 | https://pmc.ncbi.nlm.nih.gov/articles/PMC5838047/table/ece33856-tbl-0001/ | verified_primary_full_text | — |
| AMP-024 | Japanese serow | Capricornis crispus | Hoofed mammal | wild | tested_wild_not_found | life table (PrR) | 0.000 | 0.0 | no | 20 | — | No significant life stage after reproduction in this wild population | Population-growth sensitivity range 0-0; one population | Ellis et al. 2018, Ecology and Evolution 8:2482-2494, Table 1 | https://pmc.ncbi.nlm.nih.gov/articles/PMC5838047/ | 2018 | 2026-09-29 | — | — | 0 | 0 | demographic_prr | Demographic PrR: estimated post-reproductive adult female life-years / all adult female life-years; not a percentage of females. B and M definitions follow the source. Ellis 2018 uses first observed reproduction for age B; M is 95% of summed age-specific fecundity, independent of mortality. Table 1 values used consistently; prose differs for humans and orcas. Scenario endpoints are sensitivity results under alternative population growth assumptions, not confidence limits. | Table 1; Methods 2.2-2.5 | https://pmc.ncbi.nlm.nih.gov/articles/PMC5838047/table/ece33856-tbl-0001/ | verified_primary_full_text | — |
| AMP-025 | Killer whale (orca) | Orcinus orca | Toothed whale | wild | strong_wild | life table (PrR) | 0.309 | 30.9 | yes | 41 | — | Significant life stage after reproduction in the wild | One population; values from different studies use different data periods | Ellis et al. 2018, Ecology and Evolution 8:2482-2494, Table 1 | https://pmc.ncbi.nlm.nih.gov/articles/PMC5838047/ | 2018 | 2026-09-29 | — | — | — | — | — | Demographic PrR: estimated post-reproductive adult female life-years / all adult female life-years; not a percentage of females. B and M definitions follow the source. Ellis 2018 uses first observed reproduction for age B; M is 95% of summed age-specific fecundity, independent of mortality. Table 1 values used consistently; prose differs for humans and orcas. | Table 1; Methods 2.2-2.5 | https://pmc.ncbi.nlm.nih.gov/articles/PMC5838047/table/ece33856-tbl-0001/ | verified_primary_full_text | — |
| AMP-026 | Lechwe | Kobus leche | Hoofed mammal | wild | tested_wild_not_found | life table (PrR) | 0.003 | 0.3 | no | 11 | — | No significant life stage after reproduction in this wild population | Population-growth sensitivity range 0.002-0.006; one population | Ellis et al. 2018, Ecology and Evolution 8:2482-2494, Table 1 | https://pmc.ncbi.nlm.nih.gov/articles/PMC5838047/ | 2018 | 2026-09-29 | — | — | 0.002 | 0.006 | demographic_prr | Demographic PrR: estimated post-reproductive adult female life-years / all adult female life-years; not a percentage of females. B and M definitions follow the source. Ellis 2018 uses first observed reproduction for age B; M is 95% of summed age-specific fecundity, independent of mortality. Table 1 values used consistently; prose differs for humans and orcas. Scenario endpoints are sensitivity results under alternative population growth assumptions, not confidence limits. | Table 1; Methods 2.2-2.5 | https://pmc.ncbi.nlm.nih.gov/articles/PMC5838047/table/ece33856-tbl-0001/ | verified_primary_full_text | — |
| AMP-027 | Leopard | Panthera pardus | Carnivore | wild | tested_wild_not_found | life table (PrR) | 0.012 | 1.2 | no | 16 | — | No significant life stage after reproduction in this wild population | One population; values from different studies use different data periods | Ellis et al. 2018, Ecology and Evolution 8:2482-2494, Table 1 | https://pmc.ncbi.nlm.nih.gov/articles/PMC5838047/ | 2018 | 2026-09-29 | — | — | — | — | — | Demographic PrR: estimated post-reproductive adult female life-years / all adult female life-years; not a percentage of females. B and M definitions follow the source. Ellis 2018 uses first observed reproduction for age B; M is 95% of summed age-specific fecundity, independent of mortality. Table 1 values used consistently; prose differs for humans and orcas. | Table 1; Methods 2.2-2.5 | https://pmc.ncbi.nlm.nih.gov/articles/PMC5838047/table/ece33856-tbl-0001/ | verified_primary_full_text | — |
| AMP-028 | Lion | Panthera leo | Carnivore | wild | tested_wild_not_found | life table (PrR) | 0.004 | 0.4 | no | 15 | — | No significant life stage after reproduction in this wild population | One population; values from different studies use different data periods | Ellis et al. 2018, Ecology and Evolution 8:2482-2494, Table 1 | https://pmc.ncbi.nlm.nih.gov/articles/PMC5838047/ | 2018 | 2026-09-29 | — | — | — | — | — | Demographic PrR: estimated post-reproductive adult female life-years / all adult female life-years; not a percentage of females. B and M definitions follow the source. Ellis 2018 uses first observed reproduction for age B; M is 95% of summed age-specific fecundity, independent of mortality. Table 1 values used consistently; prose differs for humans and orcas. | Table 1; Methods 2.2-2.5 | https://pmc.ncbi.nlm.nih.gov/articles/PMC5838047/table/ece33856-tbl-0001/ | verified_primary_full_text | — |
| AMP-029 | Long-finned pilot whale | Globicephala melas | Toothed whale | wild | tested_wild_not_found | life table (PrR) | 0.002 | 0.2 | no | 57 | — | No significant life stage after reproduction in this wild population | Population-growth sensitivity range 0-0.002; one population | Ellis et al. 2018, Ecology and Evolution 8:2482-2494, Table 1 | https://pmc.ncbi.nlm.nih.gov/articles/PMC5838047/ | 2018 | 2026-09-29 | — | — | 0 | 0.002 | demographic_prr | Demographic PrR: estimated post-reproductive adult female life-years / all adult female life-years; not a percentage of females. B and M definitions follow the source. Ellis 2018 uses first observed reproduction for age B; M is 95% of summed age-specific fecundity, independent of mortality. Table 1 values used consistently; prose differs for humans and orcas. Scenario endpoints are sensitivity results under alternative population growth assumptions, not confidence limits. | Table 1; Methods 2.2-2.5 | https://pmc.ncbi.nlm.nih.gov/articles/PMC5838047/table/ece33856-tbl-0001/ | verified_primary_full_text | — |
| AMP-030 | Meerkat | Suricata suricatta | Carnivore | wild | tested_wild_not_found | life table (PrR) | 0.004 | 0.4 | no | 12 | — | No significant life stage after reproduction in this wild population | Population-growth sensitivity range 0.002-0.008; one population | Ellis et al. 2018, Ecology and Evolution 8:2482-2494, Table 1 | https://pmc.ncbi.nlm.nih.gov/articles/PMC5838047/ | 2018 | 2026-09-29 | — | — | 0.002 | 0.008 | demographic_prr | Demographic PrR: estimated post-reproductive adult female life-years / all adult female life-years; not a percentage of females. B and M definitions follow the source. Ellis 2018 uses first observed reproduction for age B; M is 95% of summed age-specific fecundity, independent of mortality. Table 1 values used consistently; prose differs for humans and orcas. Scenario endpoints are sensitivity results under alternative population growth assumptions, not confidence limits. | Table 1; Methods 2.2-2.5 | https://pmc.ncbi.nlm.nih.gov/articles/PMC5838047/table/ece33856-tbl-0001/ | verified_primary_full_text | — |
| AMP-031 | Moose | Alces alces | Hoofed mammal | wild | tested_wild_not_found | life table (PrR) | 0.020 | 2.0 | no | 15 | — | No significant life stage after reproduction in this wild population | Population-growth sensitivity range 0.007-0.029; one population | Ellis et al. 2018, Ecology and Evolution 8:2482-2494, Table 1 | https://pmc.ncbi.nlm.nih.gov/articles/PMC5838047/ | 2018 | 2026-09-29 | — | — | 0.007 | 0.029 | demographic_prr | Demographic PrR: estimated post-reproductive adult female life-years / all adult female life-years; not a percentage of females. B and M definitions follow the source. Ellis 2018 uses first observed reproduction for age B; M is 95% of summed age-specific fecundity, independent of mortality. Table 1 values used consistently; prose differs for humans and orcas. Scenario endpoints are sensitivity results under alternative population growth assumptions, not confidence limits. | Table 1; Methods 2.2-2.5 | https://pmc.ncbi.nlm.nih.gov/articles/PMC5838047/table/ece33856-tbl-0001/ | verified_primary_full_text | — |
| AMP-032 | North American beaver | Castor canadensis | Rodent | wild | tested_wild_not_found | life table (PrR) | 0.003 | 0.3 | no | 13 | — | No significant life stage after reproduction in this wild population | Population-growth sensitivity range 0.002-0.007; one population | Ellis et al. 2018, Ecology and Evolution 8:2482-2494, Table 1 | https://pmc.ncbi.nlm.nih.gov/articles/PMC5838047/ | 2018 | 2026-09-29 | — | — | 0.002 | 0.007 | demographic_prr | Demographic PrR: estimated post-reproductive adult female life-years / all adult female life-years; not a percentage of females. B and M definitions follow the source. Ellis 2018 uses first observed reproduction for age B; M is 95% of summed age-specific fecundity, independent of mortality. Table 1 values used consistently; prose differs for humans and orcas. Scenario endpoints are sensitivity results under alternative population growth assumptions, not confidence limits. | Table 1; Methods 2.2-2.5 | https://pmc.ncbi.nlm.nih.gov/articles/PMC5838047/table/ece33856-tbl-0001/ | verified_primary_full_text | — |
| AMP-033 | Northern fur seal | Callorhinus ursinus | Seal or sea lion | wild | tested_wild_not_found | life table (PrR) | 0.002 | 0.2 | no | 21 | — | No significant life stage after reproduction in this wild population | Population-growth sensitivity range 0-0.002; one population | Ellis et al. 2018, Ecology and Evolution 8:2482-2494, Table 1 | https://pmc.ncbi.nlm.nih.gov/articles/PMC5838047/ | 2018 | 2026-09-29 | — | — | 0 | 0.002 | demographic_prr | Demographic PrR: estimated post-reproductive adult female life-years / all adult female life-years; not a percentage of females. B and M definitions follow the source. Ellis 2018 uses first observed reproduction for age B; M is 95% of summed age-specific fecundity, independent of mortality. Table 1 values used consistently; prose differs for humans and orcas. Scenario endpoints are sensitivity results under alternative population growth assumptions, not confidence limits. | Table 1; Methods 2.2-2.5 | https://pmc.ncbi.nlm.nih.gov/articles/PMC5838047/table/ece33856-tbl-0001/ | verified_primary_full_text | — |
| AMP-034 | Olive baboon | Papio anubis | Primate | wild | tested_wild_not_found | life table (PrR) | 0.020 | 2.0 | no | 23 | — | No significant life stage after reproduction in this wild population | One population; values from different studies use different data periods | Ellis et al. 2018, Ecology and Evolution 8:2482-2494, Table 1 | https://pmc.ncbi.nlm.nih.gov/articles/PMC5838047/ | 2018 | 2026-09-29 | — | — | — | — | — | Demographic PrR: estimated post-reproductive adult female life-years / all adult female life-years; not a percentage of females. B and M definitions follow the source. Ellis 2018 uses first observed reproduction for age B; M is 95% of summed age-specific fecundity, independent of mortality. Table 1 values used consistently; prose differs for humans and orcas. | Table 1; Methods 2.2-2.5 | https://pmc.ncbi.nlm.nih.gov/articles/PMC5838047/table/ece33856-tbl-0001/ | verified_primary_full_text | — |
| AMP-035 | Plains zebra | Equus quagga | Hoofed mammal | wild | tested_wild_not_found | life table (PrR) | 0.006 | 0.6 | no | 19 | — | No significant life stage after reproduction in this wild population | Population-growth sensitivity range 0.002-0.011; one population | Ellis et al. 2018, Ecology and Evolution 8:2482-2494, Table 1 | https://pmc.ncbi.nlm.nih.gov/articles/PMC5838047/ | 2018 | 2026-09-29 | — | — | 0.002 | 0.011 | demographic_prr | Demographic PrR: estimated post-reproductive adult female life-years / all adult female life-years; not a percentage of females. B and M definitions follow the source. Ellis 2018 uses first observed reproduction for age B; M is 95% of summed age-specific fecundity, independent of mortality. Table 1 values used consistently; prose differs for humans and orcas. Scenario endpoints are sensitivity results under alternative population growth assumptions, not confidence limits. | Table 1; Methods 2.2-2.5 | https://pmc.ncbi.nlm.nih.gov/articles/PMC5838047/table/ece33856-tbl-0001/ | verified_primary_full_text | — |
| AMP-036 | Polar bear | Ursus maritimus | Carnivore | wild | tested_wild_not_found | life table (PrR) | 0.013 | 1.3 | no | 27 | — | No significant life stage after reproduction in this wild population | Population-growth sensitivity range 0.004-0.019; one population | Ellis et al. 2018, Ecology and Evolution 8:2482-2494, Table 1 | https://pmc.ncbi.nlm.nih.gov/articles/PMC5838047/ | 2018 | 2026-09-29 | — | — | 0.004 | 0.019 | demographic_prr | Demographic PrR: estimated post-reproductive adult female life-years / all adult female life-years; not a percentage of females. B and M definitions follow the source. Ellis 2018 uses first observed reproduction for age B; M is 95% of summed age-specific fecundity, independent of mortality. Table 1 values used consistently; prose differs for humans and orcas. Scenario endpoints are sensitivity results under alternative population growth assumptions, not confidence limits. | Table 1; Methods 2.2-2.5 | https://pmc.ncbi.nlm.nih.gov/articles/PMC5838047/table/ece33856-tbl-0001/ | verified_primary_full_text | — |
| AMP-037 | Pyrenean chamois | Rupicapra pyrenaica | Hoofed mammal | wild | tested_wild_not_found | life table (PrR) | 0.001 | 0.1 | no | 11 | — | No significant life stage after reproduction in this wild population | Population-growth sensitivity range 0.001-0.001; one population Study population was predator-free. | Ellis et al. 2018, Ecology and Evolution 8:2482-2494, Table 1 | https://pmc.ncbi.nlm.nih.gov/articles/PMC5838047/ | 2018 | 2026-09-29 | — | — | 0.001 | 0.001 | demographic_prr | Demographic PrR: estimated post-reproductive adult female life-years / all adult female life-years; not a percentage of females. B and M definitions follow the source. Ellis 2018 uses first observed reproduction for age B; M is 95% of summed age-specific fecundity, independent of mortality. Table 1 values used consistently; prose differs for humans and orcas. Scenario endpoints are sensitivity results under alternative population growth assumptions, not confidence limits. | Table 1; Methods 2.2-2.5 | https://pmc.ncbi.nlm.nih.gov/articles/PMC5838047/table/ece33856-tbl-0001/ | verified_primary_full_text | — |
| AMP-038 | Raccoon | Procyon lotor | Carnivore | wild | tested_wild_not_found | life table (PrR) | 0.004 | 0.4 | no | 12 | — | No significant life stage after reproduction in this wild population | Population-growth sensitivity range 0.002-0.005; one population | Ellis et al. 2018, Ecology and Evolution 8:2482-2494, Table 1 | https://pmc.ncbi.nlm.nih.gov/articles/PMC5838047/ | 2018 | 2026-09-29 | — | — | 0.002 | 0.005 | demographic_prr | Demographic PrR: estimated post-reproductive adult female life-years / all adult female life-years; not a percentage of females. B and M definitions follow the source. Ellis 2018 uses first observed reproduction for age B; M is 95% of summed age-specific fecundity, independent of mortality. Table 1 values used consistently; prose differs for humans and orcas. Scenario endpoints are sensitivity results under alternative population growth assumptions, not confidence limits. | Table 1; Methods 2.2-2.5 | https://pmc.ncbi.nlm.nih.gov/articles/PMC5838047/table/ece33856-tbl-0001/ | verified_primary_full_text | — |
| AMP-039 | Red deer | Cervus elaphus | Hoofed mammal | wild | tested_wild_not_found | life table (PrR) | 0.001 | 0.1 | no | 17 | — | No significant life stage after reproduction in this wild population | One population; values from different studies use different data periods Study population was predator-free. | Ellis et al. 2018, Ecology and Evolution 8:2482-2494, Table 1 | https://pmc.ncbi.nlm.nih.gov/articles/PMC5838047/ | 2018 | 2026-09-29 | — | — | — | — | — | Demographic PrR: estimated post-reproductive adult female life-years / all adult female life-years; not a percentage of females. B and M definitions follow the source. Ellis 2018 uses first observed reproduction for age B; M is 95% of summed age-specific fecundity, independent of mortality. Table 1 values used consistently; prose differs for humans and orcas. | Table 1; Methods 2.2-2.5 | https://pmc.ncbi.nlm.nih.gov/articles/PMC5838047/table/ece33856-tbl-0001/ | verified_primary_full_text | — |
| AMP-040 | Reindeer | Rangifer tarandus | Hoofed mammal | wild | tested_wild_not_found | life table (PrR) | 0.001 | 0.1 | no | 16 | — | No significant life stage after reproduction in this wild population | Population-growth sensitivity range 0-0.002; one population | Ellis et al. 2018, Ecology and Evolution 8:2482-2494, Table 1 | https://pmc.ncbi.nlm.nih.gov/articles/PMC5838047/ | 2018 | 2026-09-29 | — | — | 0 | 0.002 | demographic_prr | Demographic PrR: estimated post-reproductive adult female life-years / all adult female life-years; not a percentage of females. B and M definitions follow the source. Ellis 2018 uses first observed reproduction for age B; M is 95% of summed age-specific fecundity, independent of mortality. Table 1 values used consistently; prose differs for humans and orcas. Scenario endpoints are sensitivity results under alternative population growth assumptions, not confidence limits. | Table 1; Methods 2.2-2.5 | https://pmc.ncbi.nlm.nih.gov/articles/PMC5838047/table/ece33856-tbl-0001/ | verified_primary_full_text | — |
| AMP-041 | Ring-tailed lemur | Lemur catta | Primate | wild | tested_wild_not_found | life table (PrR) | 0.001 | 0.1 | no | 16 | — | No significant life stage after reproduction in this wild population | One population; values from different studies use different data periods | Ellis et al. 2018, Ecology and Evolution 8:2482-2494, Table 1 | https://pmc.ncbi.nlm.nih.gov/articles/PMC5838047/ | 2018 | 2026-09-29 | — | — | — | — | — | Demographic PrR: estimated post-reproductive adult female life-years / all adult female life-years; not a percentage of females. B and M definitions follow the source. Ellis 2018 uses first observed reproduction for age B; M is 95% of summed age-specific fecundity, independent of mortality. Table 1 values used consistently; prose differs for humans and orcas. | Table 1; Methods 2.2-2.5 | https://pmc.ncbi.nlm.nih.gov/articles/PMC5838047/table/ece33856-tbl-0001/ | verified_primary_full_text | — |
| AMP-042 | Short-finned pilot whale | Globicephala macrorhynchus | Toothed whale | wild | strong_wild | life table (PrR) | 0.260 | 26.0 | yes | 34 | — | Significant life stage after reproduction in the wild | Population-growth sensitivity range 0.131-0.352; one population | Ellis et al. 2018, Ecology and Evolution 8:2482-2494, Table 1 | https://pmc.ncbi.nlm.nih.gov/articles/PMC5838047/ | 2018 | 2026-09-29 | — | — | 0.131 | 0.352 | demographic_prr | Demographic PrR: estimated post-reproductive adult female life-years / all adult female life-years; not a percentage of females. B and M definitions follow the source. Ellis 2018 uses first observed reproduction for age B; M is 95% of summed age-specific fecundity, independent of mortality. Table 1 values used consistently; prose differs for humans and orcas. Scenario endpoints are sensitivity results under alternative population growth assumptions, not confidence limits. | Table 1; Methods 2.2-2.5 | https://pmc.ncbi.nlm.nih.gov/articles/PMC5838047/table/ece33856-tbl-0001/ | verified_primary_full_text | — |
| AMP-043 | Soay sheep | Ovis aries | Hoofed mammal | wild | tested_wild_not_found | life table (PrR) | 0.001 | 0.1 | no | 13 | — | No significant life stage after reproduction in this wild population | One population; values from different studies use different data periods | Ellis et al. 2018, Ecology and Evolution 8:2482-2494, Table 1 | https://pmc.ncbi.nlm.nih.gov/articles/PMC5838047/ | 2018 | 2026-09-29 | — | — | — | — | — | Demographic PrR: estimated post-reproductive adult female life-years / all adult female life-years; not a percentage of females. B and M definitions follow the source. Ellis 2018 uses first observed reproduction for age B; M is 95% of summed age-specific fecundity, independent of mortality. Table 1 values used consistently; prose differs for humans and orcas. | Table 1; Methods 2.2-2.5 | https://pmc.ncbi.nlm.nih.gov/articles/PMC5838047/table/ece33856-tbl-0001/ | verified_primary_full_text | — |
| AMP-044 | Steller sea lion | Eumetopias jubatus | Seal or sea lion | wild | tested_wild_not_found | life table (PrR) | 0.017 | 1.7 | no | 27 | — | No significant life stage after reproduction in this wild population | Population-growth sensitivity range 0.008-0.029; one population | Ellis et al. 2018, Ecology and Evolution 8:2482-2494, Table 1 | https://pmc.ncbi.nlm.nih.gov/articles/PMC5838047/ | 2018 | 2026-09-29 | — | — | 0.008 | 0.029 | demographic_prr | Demographic PrR: estimated post-reproductive adult female life-years / all adult female life-years; not a percentage of females. B and M definitions follow the source. Ellis 2018 uses first observed reproduction for age B; M is 95% of summed age-specific fecundity, independent of mortality. Table 1 values used consistently; prose differs for humans and orcas. Scenario endpoints are sensitivity results under alternative population growth assumptions, not confidence limits. | Table 1; Methods 2.2-2.5 | https://pmc.ncbi.nlm.nih.gov/articles/PMC5838047/table/ece33856-tbl-0001/ | verified_primary_full_text | — |
| AMP-045 | Verreaux's sifaka | Propithecus verreauxi | Primate | wild | tested_wild_not_found | life table (PrR) | 0.003 | 0.3 | no | 30 | — | No significant life stage after reproduction in this wild population | One population; values from different studies use different data periods | Ellis et al. 2018, Ecology and Evolution 8:2482-2494, Table 1 | https://pmc.ncbi.nlm.nih.gov/articles/PMC5838047/ | 2018 | 2026-09-29 | — | — | — | — | — | Demographic PrR: estimated post-reproductive adult female life-years / all adult female life-years; not a percentage of females. B and M definitions follow the source. Ellis 2018 uses first observed reproduction for age B; M is 95% of summed age-specific fecundity, independent of mortality. Table 1 values used consistently; prose differs for humans and orcas. | Table 1; Methods 2.2-2.5 | https://pmc.ncbi.nlm.nih.gov/articles/PMC5838047/table/ece33856-tbl-0001/ | verified_primary_full_text | — |
| AMP-046 | Walrus | Odobenus rosmarus | Walrus (pinniped) | wild | tested_wild_not_found | life table (PrR) | 0.018 | 1.8 | no | 24 | — | No significant life stage after reproduction in this wild population | Population-growth sensitivity range 0.008-0.029; one population | Ellis et al. 2018, Ecology and Evolution 8:2482-2494, Table 1 | https://pmc.ncbi.nlm.nih.gov/articles/PMC5838047/ | 2018 | 2026-09-29 | — | — | 0.008 | 0.029 | demographic_prr | Demographic PrR: estimated post-reproductive adult female life-years / all adult female life-years; not a percentage of females. B and M definitions follow the source. Ellis 2018 uses first observed reproduction for age B; M is 95% of summed age-specific fecundity, independent of mortality. Table 1 values used consistently; prose differs for humans and orcas. Scenario endpoints are sensitivity results under alternative population growth assumptions, not confidence limits. Animal-group label checked against NOAA Fisheries: https://www.fisheries.noaa.gov/feature-story/it-seal-or-sea-lion . | Table 1; Methods 2.2-2.5 | https://pmc.ncbi.nlm.nih.gov/articles/PMC5838047/table/ece33856-tbl-0001/ | verified_primary_full_text | — |
| AMP-047 | Weddell seal | Leptonychotes weddellii | Seal or sea lion | wild | tested_wild_not_found | life table (PrR) | 0.001 | 0.1 | no | 17 | — | No significant life stage after reproduction in this wild population | Population-growth sensitivity range 0-0.002; one population | Ellis et al. 2018, Ecology and Evolution 8:2482-2494, Table 1 | https://pmc.ncbi.nlm.nih.gov/articles/PMC5838047/ | 2018 | 2026-09-29 | — | — | 0 | 0.002 | demographic_prr | Demographic PrR: estimated post-reproductive adult female life-years / all adult female life-years; not a percentage of females. B and M definitions follow the source. Ellis 2018 uses first observed reproduction for age B; M is 95% of summed age-specific fecundity, independent of mortality. Table 1 values used consistently; prose differs for humans and orcas. Scenario endpoints are sensitivity results under alternative population growth assumptions, not confidence limits. | Table 1; Methods 2.2-2.5 | https://pmc.ncbi.nlm.nih.gov/articles/PMC5838047/table/ece33856-tbl-0001/ | verified_primary_full_text | — |
| AMP-048 | West Indian manatee | Trichechus manatus | Sea cow | wild | tested_wild_not_found | life table (PrR) | 0.009 | 0.9 | no | 56 | — | No significant life stage after reproduction in this wild population | Population-growth sensitivity range 0.003-0.014; one population | Ellis et al. 2018, Ecology and Evolution 8:2482-2494, Table 1 | https://pmc.ncbi.nlm.nih.gov/articles/PMC5838047/ | 2018 | 2026-09-29 | — | — | 0.003 | 0.014 | demographic_prr | Demographic PrR: estimated post-reproductive adult female life-years / all adult female life-years; not a percentage of females. B and M definitions follow the source. Ellis 2018 uses first observed reproduction for age B; M is 95% of summed age-specific fecundity, independent of mortality. Table 1 values used consistently; prose differs for humans and orcas. Scenario endpoints are sensitivity results under alternative population growth assumptions, not confidence limits. | Table 1; Methods 2.2-2.5 | https://pmc.ncbi.nlm.nih.gov/articles/PMC5838047/table/ece33856-tbl-0001/ | verified_primary_full_text | — |
| AMP-049 | White-headed capuchin | Cebus capucinus | Primate | wild | tested_wild_not_found | life table (PrR) | 0.004 | 0.4 | no | 25 | — | No significant life stage after reproduction in this wild population | One population; values from different studies use different data periods | Ellis et al. 2018, Ecology and Evolution 8:2482-2494, Table 1 | https://pmc.ncbi.nlm.nih.gov/articles/PMC5838047/ | 2018 | 2026-09-29 | — | — | — | — | — | Demographic PrR: estimated post-reproductive adult female life-years / all adult female life-years; not a percentage of females. B and M definitions follow the source. Ellis 2018 uses first observed reproduction for age B; M is 95% of summed age-specific fecundity, independent of mortality. Table 1 values used consistently; prose differs for humans and orcas. | Table 1; Methods 2.2-2.5 | https://pmc.ncbi.nlm.nih.gov/articles/PMC5838047/table/ece33856-tbl-0001/ | verified_primary_full_text | — |
| AMP-050 | Yellow baboon | Papio cynocephalus | Primate | wild | tested_wild_not_found | life table (PrR) | 0.036 | 3.6 | no | 21 | — | No significant life stage after reproduction in this wild population | One population; values from different studies use different data periods | Ellis et al. 2018, Ecology and Evolution 8:2482-2494, Table 1 | https://pmc.ncbi.nlm.nih.gov/articles/PMC5838047/ | 2018 | 2026-09-29 | — | — | — | — | — | Demographic PrR: estimated post-reproductive adult female life-years / all adult female life-years; not a percentage of females. B and M definitions follow the source. Ellis 2018 uses first observed reproduction for age B; M is 95% of summed age-specific fecundity, independent of mortality. Table 1 values used consistently; prose differs for humans and orcas. | Table 1; Methods 2.2-2.5 | https://pmc.ncbi.nlm.nih.gov/articles/PMC5838047/table/ece33856-tbl-0001/ | verified_primary_full_text | — |
| AMP-051 | Yellow-bellied marmot | Marmota flaviventris | Rodent | wild | tested_wild_not_found | life table (PrR) | 0.006 | 0.6 | no | 12 | — | No significant life stage after reproduction in this wild population | One population; values from different studies use different data periods | Ellis et al. 2018, Ecology and Evolution 8:2482-2494, Table 1 | https://pmc.ncbi.nlm.nih.gov/articles/PMC5838047/ | 2018 | 2026-09-29 | — | — | — | — | — | Demographic PrR: estimated post-reproductive adult female life-years / all adult female life-years; not a percentage of females. B and M definitions follow the source. Ellis 2018 uses first observed reproduction for age B; M is 95% of summed age-specific fecundity, independent of mortality. Table 1 values used consistently; prose differs for humans and orcas. | Table 1; Methods 2.2-2.5 | https://pmc.ncbi.nlm.nih.gov/articles/PMC5838047/table/ece33856-tbl-0001/ | verified_primary_full_text | — |
| AMP-052 | Chimpanzee (Ngogo community, Uganda) | Pan troglodytes | Primate | wild | strong_wild | life table (PrR) + urine hormones | 0.195 | 19.5 | yes | 47 | 185 females tracked 1995-2016; 560 urine samples from 66 females | No births after age 50; hormones rose sharply after 50 as in human menopause | Ngogo community only; demographic years 1995-2016. Major respiratory outbreak occurred in 2017, after that observation window. Older ages were estimated; hormonal samples and demographic sample differ. | Wood et al. 2023, Science 382:eadd5473 | https://pmc.ncbi.nlm.nih.gov/articles/PMC10645439/ | 2023 | 2026-09-29 | — | — | — | — | — | Demographic PrR: estimated post-reproductive adult female life-years / all adult female life-years; not a percentage of females. B and M definitions follow the source. | Results; Table 1; Materials and Methods (PrR and urinary hormones) | https://pmc.ncbi.nlm.nih.gov/articles/PMC10645439/ | verified_primary_full_text | — |
| AMP-053 | Chimpanzee (five-site wild composite) | Pan troglodytes | Primate | wild | tested_wild_not_found | life table (PrR) | 0.018 | 1.8 | no | 45 | Gombe, Tai, Kanyawara, Mahale and Bossou combined | No significant life stage after reproduction | Compiled value from an earlier study | Levitis, Burger and Lackey 2013, Evolutionary Anthropology 22:66-79, Table 1 | https://doi.org/10.1002/evan.21332 | 2013 | 2026-09-29 | — | — | — | — | — | Demographic PrR: estimated post-reproductive adult female life-years / all adult female life-years; not a percentage of females. B and M definitions follow the source. | Table 1; Box 1 | https://www.researchgate.net/publication/236182053_The_human_post-fertile_lifespan_in_comparative_evolutionary_context | verified_primary_full_text | https://pmc.ncbi.nlm.nih.gov/articles/PMC10645439/ |
| AMP-054 | Rhesus macaque (wild) | Macaca mulatta | Primate | wild | tested_wild_not_found | life table (PrR) | 0.007 | 0.7 | no | 21 | — | No significant life stage after reproduction | The 2013 table gives no underlying demographic reference or named wild population; the published point estimate is verified, not its raw inputs. | Levitis, Burger and Lackey 2013, Evolutionary Anthropology 22:66-79, Table 1 | https://doi.org/10.1002/evan.21332 | 2013 | 2026-09-29 | — | — | — | — | — | Demographic PrR: estimated post-reproductive adult female life-years / all adult female life-years; not a percentage of females. B and M definitions follow the source. | Table 1; Box 1 | https://www.researchgate.net/publication/236182053_The_human_post-fertile_lifespan_in_comparative_evolutionary_context | verified_primary_full_text | https://pmc.ncbi.nlm.nih.gov/articles/PMC10645439/ |
| AMP-055 | Chimpanzee (zoos) | Pan troglodytes | Primate | zoo | captive_evidence | life table (PrR) | 0.224 | 22.4 | yes | 40 | — | Significant life after reproduction in zoos | Zoo-living composite; original ISIS inputs are restricted. Published estimate checked; raw life tables not reanalyzed. | Levitis, Burger and Lackey 2013, Evolutionary Anthropology 22:66-79, Table 1 | https://doi.org/10.1002/evan.21332 | 2013 | 2026-09-29 | — | — | — | — | — | Demographic PrR: estimated post-reproductive adult female life-years / all adult female life-years; not a percentage of females. B and M definitions follow the source. | Table 1; Box 1 | https://www.researchgate.net/publication/236182053_The_human_post-fertile_lifespan_in_comparative_evolutionary_context | verified_primary_full_text | https://pmc.ncbi.nlm.nih.gov/articles/PMC10645439/ |
| AMP-056 | Western gorilla (zoos) | Gorilla gorilla | Primate | zoo | captive_evidence | life table (PrR) | — | — | — | — | — | Zoo-living post-reproductive survival is reported in Wood et al. 2023 Table 1; its original numerical appendix could not be independently checked. | Original Appendix S2 download blocked. Numeric PrR withheld, not zero and not a claim that no estimate exists. Captive demographic record, not physiological proof of menopause. | Levitis and Lackey 2011, Methods in Ecology and Evolution 2:446-453, Appendix S2; record reproduced in Wood et al. 2023 Table 1 | https://besjournals.onlinelibrary.wiley.com/doi/full/10.1111/j.2041-210X.2011.00095.x | 2011 | 2026-09-29 | — | — | — | — | — | No public numeric value until the original Appendix S2 estimate can be checked. Do not substitute zero. | Original Appendix S2 (unavailable); Wood 2023 Table 1 (read) | https://pmc.ncbi.nlm.nih.gov/articles/PMC10645439/ | secondary_record_verified_numeric_withheld | https://pmc.ncbi.nlm.nih.gov/articles/PMC10645439/ |
| AMP-057 | Sumatran orangutan (zoos) | Pongo abelii | Primate | zoo | captive_evidence | life table (PrR) | — | — | — | — | — | Zoo-living post-reproductive survival is reported in Wood et al. 2023 Table 1; its original numerical appendix could not be independently checked. | Original Appendix S2 download blocked. Numeric PrR withheld, not zero and not a claim that no estimate exists. Captive demographic record, not physiological proof of menopause. | Levitis and Lackey 2011, Methods in Ecology and Evolution 2:446-453, Appendix S2; record reproduced in Wood et al. 2023 Table 1 | https://besjournals.onlinelibrary.wiley.com/doi/full/10.1111/j.2041-210X.2011.00095.x | 2011 | 2026-09-29 | — | — | — | — | — | No public numeric value until the original Appendix S2 estimate can be checked. Do not substitute zero. | Original Appendix S2 (unavailable); Wood 2023 Table 1 (read) | https://pmc.ncbi.nlm.nih.gov/articles/PMC10645439/ | secondary_record_verified_numeric_withheld | https://pmc.ncbi.nlm.nih.gov/articles/PMC10645439/ |
| AMP-058 | Bornean orangutan (zoos) | Pongo pygmaeus | Primate | zoo | captive_evidence | life table (PrR) | — | — | — | — | — | Zoo-living post-reproductive survival is reported in Wood et al. 2023 Table 1; its original numerical appendix could not be independently checked. | Original Appendix S2 download blocked. Numeric PrR withheld, not zero and not a claim that no estimate exists. Captive demographic record, not physiological proof of menopause. | Levitis and Lackey 2011, Methods in Ecology and Evolution 2:446-453, Appendix S2; record reproduced in Wood et al. 2023 Table 1 | https://besjournals.onlinelibrary.wiley.com/doi/full/10.1111/j.2041-210X.2011.00095.x | 2011 | 2026-09-29 | — | — | — | — | — | No public numeric value until the original Appendix S2 estimate can be checked. Do not substitute zero. | Original Appendix S2 (unavailable); Wood 2023 Table 1 (read) | https://pmc.ncbi.nlm.nih.gov/articles/PMC10645439/ | secondary_record_verified_numeric_withheld | https://pmc.ncbi.nlm.nih.gov/articles/PMC10645439/ |
| AMP-059 | Japanese macaque (zoos) | Macaca fuscata | Primate | zoo | captive_evidence | life table (PrR) | 0.247 | 24.7 | yes | 21 | — | Significant life after reproduction in zoos | Zoo-living composite; original ISIS inputs are restricted. Published estimate checked; raw life tables not reanalyzed. | Levitis, Burger and Lackey 2013, Evolutionary Anthropology 22:66-79, Table 1 | https://doi.org/10.1002/evan.21332 | 2013 | 2026-09-29 | — | — | — | — | — | Demographic PrR: estimated post-reproductive adult female life-years / all adult female life-years; not a percentage of females. B and M definitions follow the source. | Table 1; Box 1 | https://www.researchgate.net/publication/236182053_The_human_post-fertile_lifespan_in_comparative_evolutionary_context | verified_primary_full_text | https://pmc.ncbi.nlm.nih.gov/articles/PMC10645439/ |
| AMP-060 | Rhesus macaque (zoos) | Macaca mulatta | Primate | zoo | captive_evidence | life table (PrR) | 0.178 | 17.8 | yes | 24 | — | Significant life after reproduction in zoos | Zoo-living composite; original ISIS inputs are restricted. Published estimate checked; raw life tables not reanalyzed. | Levitis, Burger and Lackey 2013, Evolutionary Anthropology 22:66-79, Table 1 | https://doi.org/10.1002/evan.21332 | 2013 | 2026-09-29 | — | — | — | — | — | Demographic PrR: estimated post-reproductive adult female life-years / all adult female life-years; not a percentage of females. B and M definitions follow the source. | Table 1; Box 1 | https://www.researchgate.net/publication/236182053_The_human_post-fertile_lifespan_in_comparative_evolutionary_context | verified_primary_full_text | https://pmc.ncbi.nlm.nih.gov/articles/PMC10645439/ |
| AMP-061 | Japanese macaque (provisioned sanctuary, Texas) | Macaca fuscata | Primate | provisioned | captive_evidence | life table (PrR) | 0.054 | 5.4 | yes | 22 | — | Some life after reproduction when fed by people | Provisioned/semi-free-ranging population, not unprovisioned wild animals. Table 1 gives 0.054; the 2013 figure caption rounds/displays 0.055. Table value retained. | Levitis, Burger and Lackey 2013, Evolutionary Anthropology 22:66-79, Table 1 | https://doi.org/10.1002/evan.21332 | 2013 | 2026-09-29 | — | — | — | — | — | Demographic PrR: estimated post-reproductive adult female life-years / all adult female life-years; not a percentage of females. B and M definitions follow the source. | Table 1; Box 1 | https://www.researchgate.net/publication/236182053_The_human_post-fertile_lifespan_in_comparative_evolutionary_context | verified_primary_full_text | https://pmc.ncbi.nlm.nih.gov/articles/PMC10645439/ |
| AMP-062 | Human (!Kung hunter-gatherers, Botswana) | Homo sapiens | Human | natural-fertility population | human_reference | life table (PrR) | 0.425 | 42.5 | yes | 42 | — | Women live a large share of adult life after reproduction ends | Uses the directly checked 2013 Table 1 estimate (0.425), not the 2011 estimate (0.426) reproduced in Wood 2023. Not current population statistics. | Levitis, Burger and Lackey 2013, Evolutionary Anthropology 22:66-79, Table 1 | https://doi.org/10.1002/evan.21332 | 2013 | 2026-09-29 | — | — | — | — | — | Demographic PrR: estimated post-reproductive adult female life-years / all adult female life-years; not a percentage of females. B and M definitions follow the source. | Table 1; Box 1 | https://www.researchgate.net/publication/236182053_The_human_post-fertile_lifespan_in_comparative_evolutionary_context | verified_primary_full_text | https://pmc.ncbi.nlm.nih.gov/articles/PMC10645439/ |
| AMP-063 | Human (Ache hunter-gatherers, Paraguay) | Homo sapiens | Human | natural-fertility population | human_reference | life table (PrR) | 0.439 | 43.9 | yes | 44 | — | Women live a large share of adult life after reproduction ends | Published life-table estimate, not current population statistics; original individual observations were not reanalyzed. | Levitis, Burger and Lackey 2013, Evolutionary Anthropology 22:66-79, Table 1 | https://doi.org/10.1002/evan.21332 | 2013 | 2026-09-29 | — | — | — | — | — | Demographic PrR: estimated post-reproductive adult female life-years / all adult female life-years; not a percentage of females. B and M definitions follow the source. | Table 1; Box 1 | https://www.researchgate.net/publication/236182053_The_human_post-fertile_lifespan_in_comparative_evolutionary_context | verified_primary_full_text | https://pmc.ncbi.nlm.nih.gov/articles/PMC10645439/ |
| AMP-064 | Beluga whale | Delphinapterus leucas | Toothed whale | wild | strong_wild | ovarian activity by age | — | — | — | — | 1 of 3 positive species among 16 toothed whale species with ovary data | Ovary-based Phys-PrR of 0.27 (27.0%) under the stable-population model; significant (p < 0.001). | Wild-origin ovarian samples and modeled survival; this is not a direct birth-record PrR estimate. | Ellis et al. 2018, Scientific Reports 8:12833 | https://www.nature.com/articles/s41598-018-31047-8 | 2018 | 2026-09-29 | 0.27 | 27.0 | .19 | .33 | phys_prr | Phys-PrR: ovarian-activity-based estimate using physiological fecundity, not births. Central value assumes a stable population. Scenario endpoints use declining/growing populations, not confidence intervals. Do not merge with demographic PrR. | Table 1; physiological PrR Methods | https://www.nature.com/articles/s41598-018-31047-8 | verified_primary_full_text | — |
| AMP-065 | Narwhal | Monodon monoceros | Toothed whale | wild | strong_wild | ovarian activity by age | — | — | — | — | 1 of 3 positive species among 16 toothed whale species with ovary data | Ovary-based Phys-PrR of 0.24 (24.0%) under the stable-population model; significant (p < 0.001). | Wild-origin ovarian samples and modeled survival; this is not a direct birth-record PrR estimate. | Ellis et al. 2018, Scientific Reports 8:12833 | https://www.nature.com/articles/s41598-018-31047-8 | 2018 | 2026-09-29 | 0.24 | 24.0 | .19 | .29 | phys_prr | Phys-PrR: ovarian-activity-based estimate using physiological fecundity, not births. Central value assumes a stable population. Scenario endpoints use declining/growing populations, not confidence intervals. Do not merge with demographic PrR. | Table 1; physiological PrR Methods | https://www.nature.com/articles/s41598-018-31047-8 | verified_primary_full_text | — |
| AMP-066 | Short-finned pilot whale (ovary data) | Globicephala macrorhynchus | Toothed whale | wild | strong_wild | ovarian activity by age | — | — | — | — | 1 of 3 positive species among 16 toothed whale species with ovary data | Ovary-based Phys-PrR of 0.15 (15.0%) under the stable-population model; significant (p < 0.001). | Wild-origin ovarian samples and modeled survival; this is not a direct birth-record PrR estimate. | Ellis et al. 2018, Scientific Reports 8:12833 | https://www.nature.com/articles/s41598-018-31047-8 | 2018 | 2026-09-29 | 0.15 | 15.0 | .08 | .22 | phys_prr | Phys-PrR: ovarian-activity-based estimate using physiological fecundity, not births. Central value assumes a stable population. Scenario endpoints use declining/growing populations, not confidence intervals. Do not merge with demographic PrR. | Table 1; physiological PrR Methods | https://www.nature.com/articles/s41598-018-31047-8 | verified_primary_full_text | — |
| AMP-067 | False killer whale | Pseudorca crassidens | Toothed whale | wild | strong_wild | ovarian morphology plus demographic PrR | 0.14 | 14.0 | yes | 39 | 91 females with age data; 137 with reproductive organs examined | Combined South African and Japanese sample: demographic PrR 0.14 (14.0%) and ovarian evidence of a post-reproductive phase. | South Africa 1981 stranding and Japan 1979-1980 harvest samples. Separate demographic PrR estimates were 0.37 and 0.12. A 2018 ovarian-based test of Japanese false killer whales was not significant; the 2024 synthesis still includes the species. | Photopoulou et al. 2017, Frontiers in Zoology 14:30 | https://link.springer.com/article/10.1186/s12983-017-0208-y | 2017 | 2026-09-29 | — | — | — | — | — | Demographic PrR from the combined sample; not the physiological PrR test in Ellis 2018. Age B 10, age M 39. Population-specific estimates are not confidence limits. | Abstract; Results; Table 2 | https://link.springer.com/article/10.1186/s12983-017-0208-y | verified_primary_full_text | — |
| AMP-068 | Mountain gorilla (Bwindi, Uganda) | Gorilla beringei | Primate | wild | likely_wild_unconfirmed | life table (PrR) + birth records | 0.100 | 10.0 | yes | — | 25 adult females in 4 groups; 7 lived 10+ years past their last birth | Significant life after reproduction; authors call menopause a highly plausible cause | Methods cannot tell menopause from other causes of infertility; no hormone or ovary data in this study | Smit and Robbins 2025, PNAS 122(42):e2510998122 | https://pmc.ncbi.nlm.nih.gov/articles/PMC12557517/ | 2025 | 2026-09-29 | — | — | — | — | — | Demographic PrR: estimated post-reproductive adult female life-years / all adult female life-years; not a percentage of females. B and M definitions follow the source. | Results; demographic methods | https://pmc.ncbi.nlm.nih.gov/articles/PMC12557517/ | verified_primary_full_text | — |
| AMP-069 | Rhesus macaque (research colony) | Macaca mulatta | Primate | captive | captive_evidence | blood hormones + menstrual records + ovary tissue | — | — | — | — | 15 females aged 8-34 followed 1 year; 6 postmenopausal (ages 27-34); ovaries of 4 examined | Six of 15 captive females, aged 27-34, were classified as postmenopausal during the 1991 observation year; ovarian tissue was available from four. | Age-selected sample, not prevalence. One of the six had evidence of a possible isolated ovulation; the author still classified her as postmenopausal. | Walker 1995, American Journal of Primatology 35:59-71 | https://pmc.ncbi.nlm.nih.gov/articles/PMC10590078/ | 1995 | 2026-09-29 | — | — | — | — | — | — | Abstract; Tables I-II; Results, Menopause | https://pmc.ncbi.nlm.nih.gov/articles/PMC10590078/ | verified_primary_full_text | — |
| AMP-070 | Western lowland gorilla (zoo study) | Gorilla gorilla | Primate | zoo | captive_evidence | fecal hormone cycles | — | — | — | — | 30 females; 22 aged 30 or older; about 23% of those were acyclic | Some older females stopped cycling (menopause); about 32% showed perimenopause-like patterns | Hormone cycles only; zoo population | Atsalis and Margulis 2006, International Journal of Primatology 27:1663-1687 | https://link.springer.com/article/10.1007/s10764-006-9097-1 | 2006 | 2026-09-29 | — | — | — | — | — | — | Publisher abstract, age-30-plus subgroup | https://link.springer.com/article/10.1007/s10764-006-9097-1 | verified_primary_abstract | — |
| AMP-071 | Sumatran orangutan (one zoo female, Jersey) | Pongo abelii | Primate | zoo | captive_evidence | ultrasound + blood hormones + tissue | — | — | — | — | 1 female, about 50 years old, previously fertile | Low estradiol and high FSH; findings consistent with natural menopause | One animal; no rate or typical age can be drawn | MacLachlan et al. 2025, Zoo Biology 44(1):87-91; first online October 22, 2024 | https://onlinelibrary.wiley.com/doi/full/10.1002/zoo.21874 | 2025 | 2026-09-29 | — | — | — | — | — | — | Publisher abstract and publication history | https://onlinelibrary.wiley.com/doi/full/10.1002/zoo.21874 | verified_primary_abstract | — |
| AMP-072 | Asian elephant (semi-captive timber elephants, Myanmar) | Elephas maximus | Elephant | semi-captive | long_life_not_menopause | life table (PrR), long-term records | 0.162 | 16.2 | yes | 55 | 3,802 female semi-captive timber elephants; records through 2018 | Full-population demographic PrR 0.162 (16.2%); the authors judged physiological reproductive cessation an unlikely cause. | Semi-captive Myanmar timber elephants, not a wild population. Captive-born subgroup PrR 0.207; age-bias sensitivity estimates 0.148-0.207 across analyses are not confidence limits or proof of menopause. | Chapman et al. 2019, BMC Evolutionary Biology 19:193 | https://link.springer.com/article/10.1186/s12862-019-1513-1 | 2019 | 2026-09-29 | — | — | — | — | — | Demographic PrR; full-population Table 1 value, B 17 and M 55. Do not present it as the share of elephants with menopause. | Table 1; Results and Discussion | https://link.springer.com/article/10.1186/s12862-019-1513-1 | verified_primary_full_text | — |
| AMP-073 | Long-finned pilot whale (genetic study) | Globicephala melas | Toothed whale | wild | tested_wild_not_found | genetic parentage + reproduction | — | — | — | — | 1,522 individuals in 22 pods | Genetic study of a species lacking a widespread post-reproductive lifespan; females with many adult daughters were less likely to breed. | Individual females may still stop; not the same as no one ever stopping | Nichols et al. 2020, Behavioral Ecology 31(2):508-518 | https://academic.oup.com/beheco/article-abstract/31/2/508/5697334 | 2020 | 2026-09-29 | — | — | — | — | — | — | Publisher abstract; online January 7, 2020 | https://academic.oup.com/beheco/article-abstract/31/2/508/5697334 | verified_primary_abstract | — |
| AMP-074 | Domestic dog | Canis familiaris | Pet | pets | keeps_cycling | veterinary review | — | — | — | — | — | Most unspayed females continue heat cycles through life; gaps may grow with age. | Veterinary review, not a population prevalence study. Infertility can occur; ask a veterinarian about an individual dog. Numerical cycle-gap range omitted because its original measurement was not checked. | Hanim and Chotimanukul 2025, Journal of Veterinary Science 26(S1):S139-S156 | https://vetsci.org/DOIx.php?id=10.4142%2Fjvs.25218 | 2025 | 2026-09-29 | — | — | — | — | — | — | Observations: Reproductive aging in female dogs | https://vetsci.org/DOIx.php?id=10.4142%2Fjvs.25218 | verified_veterinary_review | — |
| AMP-075 | Domestic cat | Felis catus | Pet | pets | keeps_cycling | veterinary clinic guidance | — | — | — | — | — | Veterinary guidance says unspayed cats do not have a normal human-like menopause; older cats may still become pregnant. | Primary clinic guidance, not a species-wide physiological study; it does not guarantee fertility in every older cat. | Badger Creek Veterinary Clinic, 'Cats - Why It's Important to Spay or Neuter' (updated 2025) | https://badgercreekvetclinic.com/cats-why-its-important-to-spay-or-neuter/ | 2025 | 2026-09-29 | — | — | — | — | — | — | Section stating cats do not undergo menopause | https://badgercreekvetclinic.com/cats-why-its-important-to-spay-or-neuter/ | verified_veterinary_guidance | — |
| AMP-076 | Japanese gall aphid | Quadrartus yoshinomiyai | Insect | wild | insect_menopause_like | field behavior + reproduction | — | — | — | — | — | Older wingless females stop reproducing, then defend the colony by gluing themselves to predators with wax | An insect life stage, not mammal menopause | Uematsu et al. 2010, Current Biology 20(13):1182-1186 | https://doi.org/10.1016/j.cub.2010.04.057 | 2010 | 2026-09-29 | — | — | — | — | — | — | Original abstract, author institution record | https://keio.elsevierpure.com/en/publications/altruistic-colony-defense-by-menopausal-female-insects/ | verified_primary_abstract | — |
How many animals go through menopause, and why do sources say 3, 6, 7 or "dozens"?
It depends on the proof you require. This review counts six mammals besides humans with strong wild-population evidence. Add the likely Bwindi mountain gorillas and five additional captive primates in this ledger, and it covers 12 non-human mammals with those reports. That is a selected set, not a worldwide total. Older three-species answers reflect earlier evidence and narrower study rules—not one single source.
| The count you'll see | What it counts | Source | What it leaves out |
|---|---|---|---|
| 3 (humans, killer whales, short-finned pilot whales) | The three significant species in a study reporting 52 mammals (51 listed in Table 1) | Ellis et al., January 2018 | Belugas, narwhals, false killer whales and chimps, included in other studies or by other methods |
| 3 (short-finned pilot whales, belugas, narwhals) | Toothed whales with a post-reproductive lifespan among 16 species with ovary data | Ellis et al., August 2018 | Killer whales, which had no ovary data in that study |
| 5 whales (6 with humans) | Toothed whales classified as having menopause | Ellis et al. 2024 | Primates |
| 7 (humans, 5 whales, chimps) | The 2024 whale list plus the Ngogo chimps | Ellis et al. 2024; Wood et al. 2023 | The 2025 gorilla study and captive findings |
| 6 strong wild examples; 12 selected mammals in those categories (this page) | 6 strong in the wild + 1 likely in the wild + 5 additional captive primates | The HRT Index review, September 2026 | Other reported animals and animals not reviewed; not a total species count |
| "Dozens" | A broader definition based on when ovulation ends, using mostly captive data | Winkler and Goncalves 2023, Cell | How the same species does in the wild |
Source: The HRT Index, from the studies linked in each row; checked September 29, 2026.
The answer keeps changing
Since 2017, the studies below have added or strengthened animal-menopause evidence.
| When | What changed | Study |
|---|---|---|
| 2017 | Evidence of a post-reproductive stage in false killer whales, from ovaries and demographic data | Photopoulou et al. 2017 |
| January 2018 | Study reports 52 mammals; Table 1 lists 51, with significant results for humans, killer whales and short-finned pilot whales | Ellis et al. 2018 |
| August 2018 | Belugas and narwhals added, from ovaries | Ellis et al. 2018 |
| October 2023 | First substantial, statistically significant wild non-human primate PrR with hormonal evidence: chimpanzees at Ngogo | Wood et al. 2023 |
| March 2024 | Five toothed whales included in one comparative analysis; menopause evolved at least four times | Ellis et al. 2024 |
| October 2024 | One captive Sumatran orangutan with signs of natural menopause | MacLachlan et al., online 2024; issue 2025 |
| October 2025 | Wild mountain gorillas at Bwindi: a significant life stage after reproduction; cause not confirmed | Smit and Robbins 2025 |
Source: publication dates from each study; checked September 29, 2026.
So if you read "only three animals go through menopause," check the date and the counting rule. Three was the number with a significant result in that 2018 study, not a census of all animal menopause.
Why zoo numbers run so high
Three selected older wild–zoo comparisons give zoo shares 12.4 to 49.4 times as large. But the choice of wild population matters: comparing the same zoo chimpanzee estimate with Ngogo gives 1.15 times. Captivity can change both survival and reproduction; these are comparisons between datasets, not a test of the effect of moving animals into a zoo.
| Species and wild comparison | Wild | Zoos | Zoo share divided by wild share |
|---|---|---|---|
| Japanese macaque (2018 wild estimate) | 0.5% | 24.7% | 49.4× |
| Rhesus macaque (2013 wild estimate; population unnamed) | 0.7% | 17.8% | 25.4× |
| Chimpanzee (five-site wild composite) | 1.8% | 22.4% | 12.4× |
| Chimpanzee (Ngogo, Uganda) | 19.5% | 22.4% | 1.15× |
Source: zoo estimates, wild rhesus and five-site chimpanzees: Levitis et al. 2013, Table 1; wild Japanese macaques: Ellis et al. 2018, Table 1; Ngogo: Wood et al. 2023. Multiples calculated by The HRT Index; checked September 29, 2026. Each row uses its named source population, not all wild members of the species. The 2013 wild rhesus value has no underlying population reference in that table; raw zoo data are restricted.
For those Japanese macaque estimates, that's the same fraction as about 2 days of a year versus about 3 months of a year—not a seasonal pause in breeding.
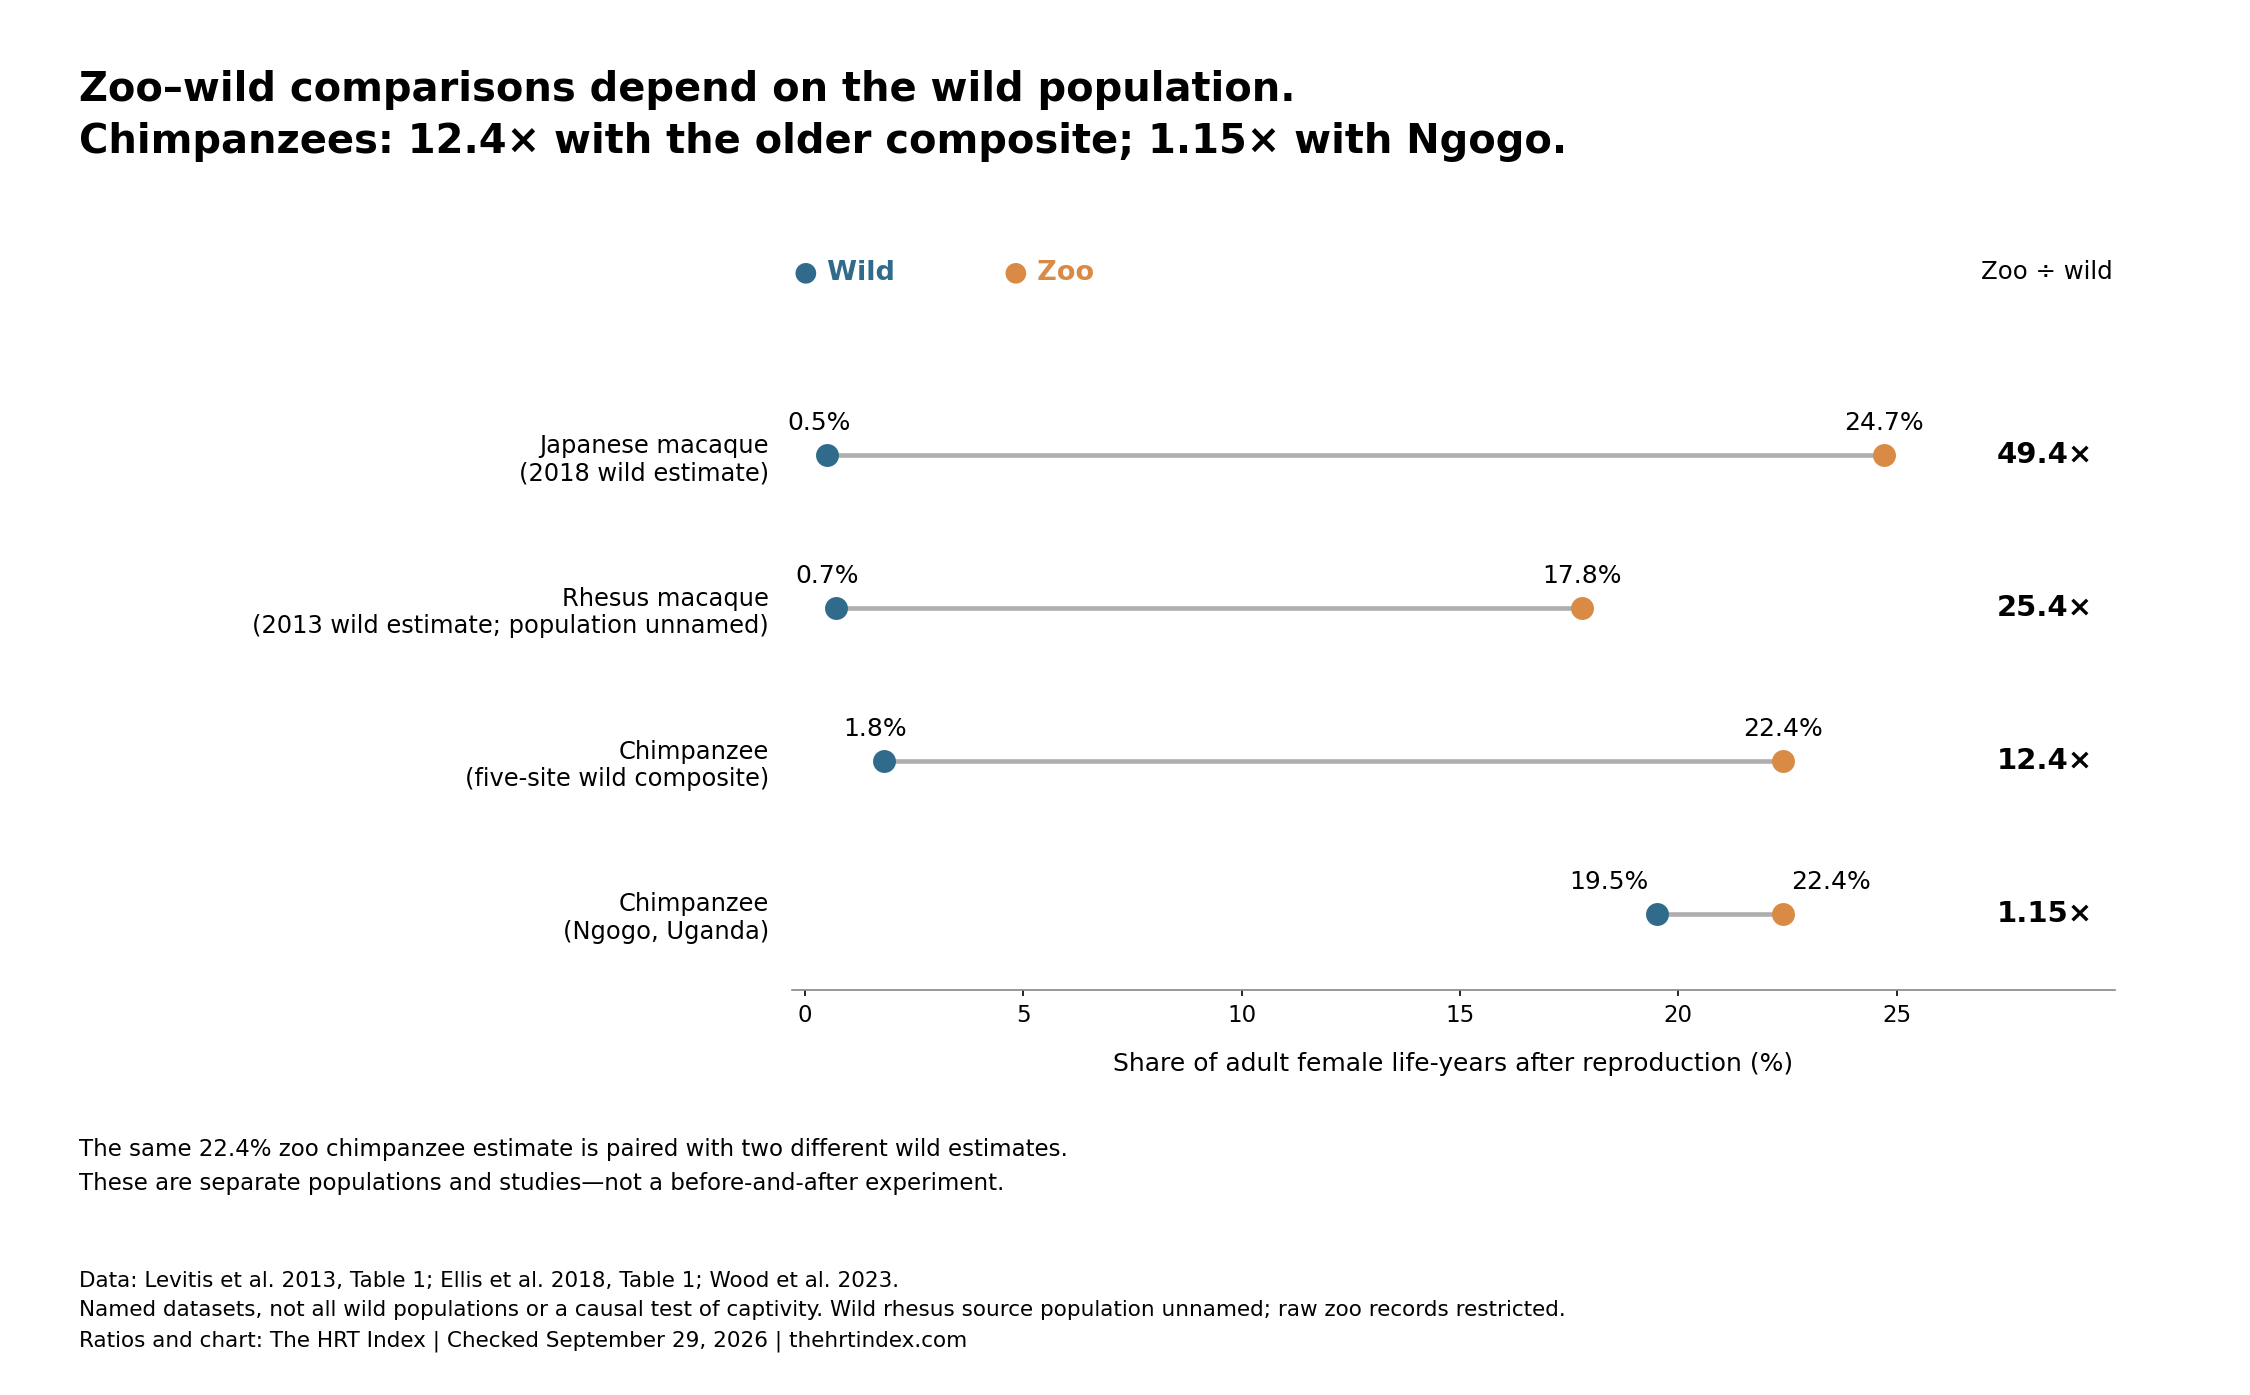
This is the heart of an open debate. A 2023 Cell commentary argued that ending ovulation before death may be common in mammals, and it leaned on captive data; it also noted this measure rises "substantially" in captivity (Winkler and Goncalves 2023). Five researchers behind the wild studies replied in a 2024 preprint that captive data can't stand in for wild animals, and that menopause is rare (Chapman et al. 2024, bioRxiv). Both describe higher post-reproductive measures in captive datasets. They disagree on what those observations can establish about mammals in the wild.
Why do some whales go through menopause?
The 2024 whale analysis supports menopause evolving through longer lives, not earlier reproductive shutdown. Females reproduce for about as long as similar whales, but their typical maximum lifespan is predicted to be about 40 years longer (mean ± standard deviation: 40 ± 5 years) than in same-sized species without menopause (Ellis et al. 2024).
That longer life creates more time when grandmothers and grandchildren could both be alive. In the model, summed grandmother–grandchild overlap was about 2.9 times as large in menopausal species (1.04 vs 0.36 relative units). Each unit divides the summed overlap by the species' age at maturity; this is not time observed caring for one grandchild.
Here's what the family studies found:
| Finding | Number | Data | Study |
|---|---|---|---|
| Death rate after a maternal grandmother died within the previous 2 years, vs a living grandmother | Mortality hazard ratio 4.5 at salmon index 1 (the 1979–1982 mean) | 378 whales with known grandmothers; southern residents 1976–2016, northern residents 1973–2016 | Nattrass et al. 2019, PNAS |
| Death rate for older-generation calves when mother and daughter breed together, vs younger-generation calves | Mortality hazard ratio 1.7 | 43 years of resident killer whale records | Croft et al. 2017, Current Biology |
| Modeled summed grandmother–grandchild overlap, menopausal vs non-menopausal toothed whales | About 2.9 times as large (1.04 vs 0.36 units, scaled by age at maturity) | Comparative analysis across toothed whales | Ellis et al. 2024, Nature |
Source: studies linked in each row; the 2.9 multiple is The HRT Index calculation (1.04 ÷ 0.36 = 2.89); checked September 29, 2026.
Put simply: an orca grandmother's help counts most in years when salmon are scarce (Nattrass et al. 2019). Older-generation calves also had higher mortality when mothers and daughters bred together. These findings support two linked ideas: helping relatives and avoiding reproductive conflict. The first two findings come from resident killer whales in the Pacific Northwest, so they aren't proof of one reason for every species.
Do chimpanzees, gorillas and other apes go through menopause?
One wild chimpanzee community does: Ngogo, in Uganda, where females spent 19.5% of adult life after reproduction and showed menopause-like hormones. Other wild chimp groups show almost none. Wild mountain gorillas at Bwindi show a likely case at 10%, while mountain gorillas measured in Rwanda did not.
| Ape | Place and setting | Share of adult life after reproduction | Significant? | Study |
|---|---|---|---|---|
| Chimpanzee | Ngogo, Uganda (wild) | 19.5% | Yes | Wood et al. 2023 |
| Chimpanzee | Five wild sites combined | 1.8% | No | Levitis et al. 2013, Table 1 |
| Chimpanzee | Gombe, Tanzania (wild) | 0.6% | No | Ellis et al. 2018 |
| Chimpanzee | Zoos | 22.4% | Yes | Levitis et al. 2013, Table 1 |
| Mountain gorilla | Bwindi, Uganda (wild) | 10.0% | Yes | Smit and Robbins 2025 |
| Mountain gorilla | Rwanda (wild) | 2.2% | No | Ellis et al. 2018, Table 1 |
| Western gorilla | Zoos | Number withheld† | Reported in later table; original unchecked | Wood et al. 2023, Table 1 |
| Sumatran orangutan | Zoos | Number withheld† | Reported in later table; original unchecked | Wood et al. 2023, Table 1 |
| Bornean orangutan | Zoos | Number withheld† | Reported in later table; original unchecked | Wood et al. 2023, Table 1 |
Source: studies linked in each row; checked September 29, 2026.
† Original numerical appendix unavailable. These are missing values, not zero; the later report is identified rather than presented as an independently verified estimate.
Ngogo's share is 32.5 times Gombe's (0.195 ÷ 0.006 = 32.5). Same species. Different forest.
Why? Nobody knows yet. The Ngogo authors report no known major disease outbreak during the 1995–2016 demographic study period. A major outbreak followed in 2017. They ask whether the long post-reproductive lives there are a lasting trait or a response to good conditions (Wood et al. 2023).
In these comparisons, humans still lead. Ngogo chimps' 19.5% is less than half the Hadza share of 44.3%.
Do elephants go through menopause?
Elephants live long, but no elephant study we reviewed has shown menopause. Wild African elephants spent 3.5% of adult life after reproduction in the 2018 test, a result that did not pass the study's test for a long post-reproductive stage. The Myanmar semi-captive Asian-elephant study estimated 16.2% of adult life after reproduction, but the researchers say that is unlikely to be caused by the ovaries shutting down.
| Elephant | Setting | Finding | Menopause? | Study |
|---|---|---|---|---|
| African elephant (Loxodonta africana) | Wild | 3.5% of adult life after reproduction; not significant | No evidence | Ellis et al. 2018 |
| Asian elephant (Elephas maximus) | Semi-captive timber elephants, Myanmar | 16.2% of adult life after reproduction in the full-population model; ovarian shutdown is an unlikely cause | No evidence | Chapman et al. 2019 |
Source: studies linked in each row; checked September 29, 2026.
Elephant grandmothers can help while still having calves. In a study of semi-captive Asian elephants in Myanmar, grandmother presence was linked to better calf survival and shorter gaps between the daughter's births. The benefits did not depend on the grandmother having stopped reproduction (Lahdenperä, Mar and Lummaa 2016). Helping grandchildren alone does not establish menopause.
A note on names, since it shows up in summaries: an editorial first published online in December 2025 (2026 journal issue) describes "the African elephant (Elaphas maximus)," but Elephas maximus is the Asian elephant, and the study it cites is about Asian elephants (Gidlöf et al., online 2025; issue 2026). The two species shouldn't be mixed.
Do dogs and cats go through menopause?
No. Most unspayed female dogs keep having heat cycles throughout life, though gaps may grow with age. Veterinary guidance says unspayed cats do not have a normal human-like menopause either. An older cat may still get pregnant; that does not mean every older cat remains fertile.
- Dogs: A 2025 veterinary review says most female dogs keep regular heat cycles throughout their lives, with longer gaps as they age (Hanim and Chotimanukul 2025).
- Cats: A veterinary clinic's guidance says unspayed cats do not go through menopause; fertility may drop with age, but pregnancy stays possible (Badger Creek Veterinary Clinic).
- Periods: Dogs and cats don't menstruate the way people do (Winkler and Goncalves 2023), so missed periods are not a usable test in these species. Lack of menstruation alone does not prove that ovarian aging or permanent loss of ovulation cannot occur.
So an older, unspayed pet can still get pregnant. Questions about a pet's cycle, spaying or a pregnancy belong with a veterinarian.
Which animals don't go through menopause?
Most species listed in the 2018 wild-mammal comparison did not have a significant post-reproductive stage. In its Table 1, 48 of 51 listed species fall in that group; their median PrR share was 0.4%. That group includes lions, polar bears, African elephants, zebras, baboons and fin whales.
Here are all 48 non-significant species listed in Table 1. The paper reports 52 species overall, while that table lists 51. Northern muriquis appear in its methods table, but no PrR value for them is shown in Table 1; we have not filled that gap with a value from another study.
| Animal | Scientific name | Group | Share of adult life after reproduction | Age M: 95% of lifetime fertility (years) |
|---|---|---|---|---|
| Yellow baboon | Papio cynocephalus | Primate | 3.6% | 21 |
| African elephant | Loxodonta africana | Elephant | 3.5% | 59 |
| American bison | Bison bison | Hoofed mammal | 2.9% | 17 |
| Mountain gorilla (Rwanda) | Gorilla beringei | Primate | 2.2% | 38 |
| Moose | Alces alces | Hoofed mammal | 2.0% | 15 |
| Olive baboon | Papio anubis | Primate | 2.0% | 23 |
| Walrus | Odobenus rosmarus | Walrus (pinniped) | 1.8% | 24 |
| Steller sea lion | Eumetopias jubatus | Seal or sea lion | 1.7% | 27 |
| Polar bear | Ursus maritimus | Carnivore | 1.3% | 27 |
| Leopard | Panthera pardus | Carnivore | 1.2% | 16 |
| Hippopotamus | Hippopotamus amphibius | Hoofed mammal | 0.9% | 41 |
| West Indian manatee | Trichechus manatus | Sea cow | 0.9% | 56 |
| Chimpanzee (Gombe, Tanzania) | Pan troglodytes | Primate | 0.6% | 50 |
| Fin whale | Balaenoptera physalus | Baleen whale | 0.6% | 95 |
| Plains zebra | Equus quagga | Hoofed mammal | 0.6% | 19 |
| Yellow-bellied marmot | Marmota flaviventris | Rodent | 0.6% | 12 |
| Blue monkey | Cercopithecus mitis | Primate | 0.5% | 29 |
| Collared peccary | Pecari tajacu | Hoofed mammal | 0.5% | 15 |
| Japanese macaque (wild) | Macaca fuscata | Primate | 0.5% | 14 |
| Antarctic fur seal | Arctocephalus gazella | Seal or sea lion | 0.4% | 17 |
| Bighorn sheep | Ovis canadensis | Hoofed mammal | 0.4% | 16 |
| European badger | Meles meles | Carnivore | 0.4% | 12 |
| Lion | Panthera leo | Carnivore | 0.4% | 15 |
| Meerkat | Suricata suricatta | Carnivore | 0.4% | 12 |
| Raccoon | Procyon lotor | Carnivore | 0.4% | 12 |
| White-headed capuchin | Cebus capucinus | Primate | 0.4% | 25 |
| Cheetah | Acinonyx jubatus | Carnivore | 0.3% | 12 |
| Himalayan tahr | Hemitragus jemlahicus | Hoofed mammal | 0.3% | 16 |
| Lechwe | Kobus leche | Hoofed mammal | 0.3% | 11 |
| North American beaver | Castor canadensis | Rodent | 0.3% | 13 |
| Verreaux's sifaka | Propithecus verreauxi | Primate | 0.3% | 30 |
| Arctic fox | Vulpes lagopus | Carnivore | 0.2% | 10 |
| Australian fur seal | Arctocephalus pusillus | Seal or sea lion | 0.2% | 20 |
| Brown bear | Ursus arctos | Carnivore | 0.2% | 30 |
| Long-finned pilot whale | Globicephala melas | Toothed whale | 0.2% | 57 |
| Northern fur seal | Callorhinus ursinus | Seal or sea lion | 0.2% | 21 |
| Belding's ground squirrel | Urocitellus beldingi | Rodent | 0.1% | 8 |
| Pyrenean chamois | Rupicapra pyrenaica | Hoofed mammal | 0.1% | 11 |
| Red deer | Cervus elaphus | Hoofed mammal | 0.1% | 17 |
| Reindeer | Rangifer tarandus | Hoofed mammal | 0.1% | 16 |
| Ring-tailed lemur | Lemur catta | Primate | 0.1% | 16 |
| Soay sheep | Ovis aries | Hoofed mammal | 0.1% | 13 |
| Weddell seal | Leptonychotes weddellii | Seal or sea lion | 0.1% | 17 |
| American red squirrel | Tamiasciurus hudsonicus | Rodent | 0.0% | 8 |
| Banded mongoose | Mungos mungo | Carnivore | 0.0% | 10 |
| Golden-mantled ground squirrel | Callospermophilus lateralis | Rodent | 0.0% | 7 |
| Hawaiian monk seal | Monachus schauinslandi | Seal or sea lion | 0.0% | 28 |
| Japanese serow | Capricornis crispus | Hoofed mammal | 0.0% | 20 |
Source: Ellis et al. 2018, Ecology and Evolution, Table 1. "Age M: 95% of lifetime fertility (years)" is the study's age M. Checked September 29, 2026. Chimpanzees, mountain gorillas and Japanese macaques appear here for the wild populations tested in 2018; other populations of each show more (see Table 6 and Table 4).
"Not found" means these wild populations, measured this way. It doesn't mean no female of the species ever stops. Some Japanese macaques do in zoos, for example.
An insect that comes close
A Japanese aphid has a menopause-like stage. In a Japanese gall aphid (Quadrartus yoshinomiyai), older wingless females stop reproducing and then defend the colony by gluing themselves to predators with sticky wax (Uematsu et al. 2010, Current Biology). It's a very different animal, but the same trade: stop breeding, help the family.
How do scientists tell if an animal is going through menopause?
They use three kinds of proof: birth and death records, ovaries and hormones. The strongest cases use more than one. Structures left in whale ovaries after egg release can help scientists estimate ovarian activity by age. They are not a perfect lifetime count of eggs.
| Method | What it shows | Used for |
|---|---|---|
| Birth and death records (PrR) | How much of adult life falls after the age marking 95% of summed age-specific fertility | Killer whales, short-finned pilot whales, Ngogo chimps, Bwindi gorillas, the 2018 comparison (51 listed rows) |
| Ovaries by age | Whether egg release stopped long before death | Belugas, narwhals, false killer whales, short-finned pilot whales, rhesus macaques |
| Hormones in urine, blood or dung | Whether cycles stop or hormones show ovarian aging; tests differ by species (for example, FSH and LH rise at Ngogo) | Ngogo chimps, rhesus macaques, western gorillas, one Sumatran orangutan |
Source: methods described in the studies in Table 1; checked September 29, 2026.
Here's the PrR idea with real numbers from Ngogo. Females count as adults at 14. Age 47 marks 95% of its summed age-specific fertility. That means adding the birth rate at each age, not counting when 95% of observed babies were born. Out of every 100 adult years lived, 19.5 come after 47 (Wood et al. 2023).
One caution. A female that stops having babies hasn't necessarily gone through menopause. She could be losing pregnancies or not mating. That's why Bwindi is "likely, not confirmed": the authors could not establish the cause. The five whale species follow the 2024 synthesis; Ngogo adds hormone evidence. The labels describe this evidence set, not a universal diagnostic rule.
What about hot flashes? No study we reviewed measured hot flashes in wild animals. Symptoms like that are very hard to study in the wild, so research sticks to births, ovaries and hormones (Gidlöf et al., online 2025; issue 2026).
What does animal menopause mean for human menopause?
Humans still stand out. The three hunter-gatherer estimates below put roughly 43% to 44% of adult life after reproduction ends, above the selected wild non-human estimates in this page's demographic chart. In people, natural menopause usually happens between ages 45 and 55 (World Health Organization).
| Group | Share of adult life after reproduction | Study |
|---|---|---|
| Hadza hunter-gatherers, Tanzania | 44.3% | Ellis et al. 2018 |
| Ache hunter-gatherers, Paraguay | 43.9% | Levitis et al. 2013, Table 1 |
| !Kung hunter-gatherers, Botswana | 42.5% | Levitis et al. 2013, Table 1 |
Source: studies linked in each row; checked September 29, 2026.
The whale work backs an old idea about people, the "grandmother effect": long life after fertility can help a family survive (Nattrass et al. 2019). Some researchers now describe menopause as a shift from one role to another, not only a loss (Gidlöf et al., online 2025; issue 2026). None of this says anything about one person's treatment.
For the human numbers, start with the average age of menopause and what postmenopause means. For treatment questions, our guides explain how menopausal hormone therapy works and HRT benefits and risks. The full human picture is in our menopause statistics.
If you're in perimenopause or menopause yourself, the free Find My HRT Path quiz can help you sort out which kind of care fits before a first appointment.
How we built this
We checked primary papers, published abstracts and veterinary guidance, and pulled their findings into one ledger: 76 records covering 61 animal species plus humans, checked September 29, 2026. This is a compilation with our calculations, not a new animal study.
- What we collected: all 51 numerical rows actually listed in Ellis et al. 2018, Table 1; the additional primate and human comparisons traced through Wood et al. 2023 to Levitis et al. 2013, Table 1; and the ovary, hormone, genetic and veterinary findings linked on this page. We retained three zoo records but withheld their percentages because their original 2011 numerical appendix could not be checked.
- How we graded: “Strong, in the wild” covers the five whale species in the 2024 synthesis and the demographic-plus-hormonal Ngogo result. “Likely, not confirmed” is the Bwindi result, whose authors consider menopause plausible but could not establish it. “Captive evidence” describes the setting, not proof that a species can never show the pattern in the wild. Demographic-only captive records are not treated as hormonal diagnoses. The grades are our reading of this evidence, not a validated scoring system or complete species list.
- Math we did: percentages (PrR × 100), ratios (0.309 ÷ 0.036 = 8.58; 0.26 ÷ 0.002 = 130; 0.195 ÷ 0.006 = 32.5; 0.247 ÷ 0.005 = 49.4; 0.178 ÷ 0.007 = 25.4; 0.224 ÷ 0.018 = 12.4; 0.224 ÷ 0.195 = 1.15; 1.04 ÷ 0.36 = 2.89), the median of 48 listed non-significant PrR values (0.004, or 0.4%), and counts of distinct species by our categories. We did not rerun the researchers' survival models or reanalyze restricted zoo records.
- How to reproduce it: use records AMP-001 through AMP-051 for the 2018 table; select
prrsignificant = nofor its 48-species subset and median. Match the named populations before dividing values. Species counts use distinctscientificnamevalues, not numbers of rows; humans are excluded from non-human totals. Table 4 and both charts have matching records and calculations in the companion metrics file. Keep demographic PrR and ovary-based Phys-PrR separate. - How deep we went: full-text methods/results were read for the two Ellis 2018 papers, Ellis 2024, Wood 2023, Smit and Robbins 2025, Photopoulou 2017, Chapman 2019, Walker 1995, Nattrass 2019, Levitis 2013, Lahdenperä et al. 2016 and the comparative commentaries. The gorilla hormone study, orangutan case, long-finned pilot-whale genetic study, Croft 2017 and aphid report were checked at their primary published abstract or author-held abstract; only findings stated there are used. Veterinary claims are identified as guidance or review, not original field measurements.
- Independence: this reference has no affiliate links, provider recommendations or sponsored placements.
For demographic PrR, the basic formula is TM / TB: expected life-years after the end-of-fertility threshold divided by expected adult life-years. The studies do not all define adulthood B the same way. Ellis 2018 uses age at first reproduction; Levitis 2013 and Wood 2023 use the 5% cumulative-fertility threshold. These differences are one reason the comparisons are not pooled into a single species-wide rate.
Source differences kept visible
The 2018 mammal paper says 52 species in its text, but its Table 1 lists 51. We use the 51 listed rows for calculations: three significant results and 48 non-significant results. Its Results prose also gives PrR as 0.34 for killer whales and 0.43 for humans, while Table 1 gives 0.309 and 0.443. This page consistently uses the table values; it does not average the conflicting numbers or claim to resolve the paper's discrepancy.
The !Kung row uses the directly checked 2013 estimate of 42.5%. Wood's later table reproduces 42.6% from the 2011 paper; that original numerical appendix was unavailable. These are different published estimates, not a calculation of change over time. The three zoo percentages that depended on that same appendix are withheld. Their records and source trail remain in the ledger.
What this data does and doesn't show
- Different studies, different years. The listed 2018 species share a study method; zoo values and the 2025 gorilla value come from other studies. Even demographic PrR studies differ in where adulthood begins. We show each source rather than pool the numbers.
- Ovary findings have a different percentage. Beluga, narwhal and short-finned pilot-whale Phys-PrR estimates use ovarian activity, not births. They stay separate from the demographic chart. Growth-scenario ranges are not confidence intervals.
- A percentage of life-years isn't a percentage of animals. Ngogo's 19.5% is a share of adult years, not the share of females with menopause. Bwindi's "7 of 25" is a count of females. Don't put them on the same scale.
- One community isn't a species. The Ngogo and Bwindi findings are each from one place.
- Zoo findings do not by themselves establish a wild-population trait. Captivity can change reproduction as well as survival.
- One orangutan is one case. It can't give a rate or a typical age.
- "Not found" isn't "never." It means these populations, measured this way.
- Symptoms aren't measured. Nothing here tells you whether animals feel menopause the way people do.
- This is education, not medical or veterinary advice.
How to cite this page
The HRT Index Editorial Team. "Animals That Go Through Menopause: 6 Wild Species, Graded by Evidence." The HRT Index Research. Updated September 2026. https://thehrtindex.com/research/animals-that-go-through-menopause/
Dataset: The HRT Index Animal Menopause Evidence Ledger, version 1.1 (September 29, 2026).
Each key statistic has a stable section anchor and a linked source.
You may reuse our original tables, charts and calculations with credit to The HRT Index. The underlying findings belong to the researchers who published them; keep their credit and follow each source's own license terms.
Download the data
The full ledger is free, with no sign-up: animal-menopause-evidence-ledger.csv and animal-menopause-evidence-ledger.json. It has 76 records and 28 columns. Every record carries its source, source link and check date.
Columns: recordid · commonname · scientificname · animalgroup · setting · evidencelevel · evidencetype · prr · prrpctadultlife · prrsignificant · agem95pctfertility · sample · finding · limit · source · sourceurl · sourceyear · checkedon · physprr · physprrpctadultlife · scenariolow · scenariohigh · scenariometric · metricnotes · sourcelocator · sourcereadurl · verificationstatus · secondarysource_url.
prr is the demographic life-table share; physprr is the separate ovarian-activity measure. Each percentage field is its matching share × 100. agem95pctfertility is the age marking 95% of summed age-specific fertility, not 95% of raw birth counts. Scenario bounds are growth or age-sensitivity analyses, not confidence intervals. Blank numbers are missing, never zero; verificationstatus and metricnotes explain why.
Download the calculations and chart data. This companion file gives the inputs, units, population and calculation behind each displayed ratio, chart point and headline count.
Frequently asked questions
How many animals go through menopause?
This review identifies six mammals besides humans with strong wild-population evidence: killer whales, short-finned pilot whales, false killer whales, belugas, narwhals and chimpanzees at Ngogo. It also covers Bwindi mountain gorillas (likely, not confirmed) and five additional captive primates. Those 12 are a selected evidence set, not a complete count of animal menopause. Whale study. chimpanzee study.
Do elephants go through menopause?
No elephant study we reviewed has shown menopause. Wild African elephants spent 3.5% of adult life after reproduction in a 2018 test, which was not significant. The Myanmar semi-captive Asian-elephant study estimated 16.2%, but researchers judged ovarian shutdown an unlikely cause. African-elephant estimate. Asian-elephant study.
Do gorillas have menopause?
Possibly. Wild mountain gorillas at Bwindi, Uganda, spent 10% of adult life after reproduction in a 2025 study, and the authors call menopause a highly plausible cause but couldn't confirm it. In zoos, about 23% of 22 western gorillas aged 30 or older had stopped cycling. Bwindi study. captive-gorilla study.
Do female cats go through menopause?
Veterinary guidance says unspayed cats do not have a normal human-like menopause. Fertility may drop with age, but an older cat may still become pregnant; this is not a guarantee of lifelong fertility in every cat. Veterinary guidance.
Do dogs go through menopause?
No. Most unspayed female dogs keep having heat cycles throughout life, with gaps that may grow with age. An older unspayed dog can still get pregnant. Veterinary review.
Do orcas go through menopause?
Yes. Female killer whales spend 30.9% of their adult years after reproduction ends, the highest wild non-human share in the 2018 study's Table 1 (51 listed species; 52 reported in the paper). The table puts age M at 41: the threshold for 95% of summed age-specific fertility, not the age by which 95% of observed calves were born. Study table.
Do chimpanzees go through menopause?
One wild community does. At Ngogo, Uganda, no female gave birth after 50, and females spent 19.5% of adult life after reproduction, with menopause-like hormones. Other wild chimp groups show almost none, such as 0.6% at Gombe. Ngogo study. Gombe estimate.
Why do killer whales go through menopause?
Two findings support helping relatives and avoiding reproductive conflict. At salmon index 1, the mortality hazard ratio was 4.5 after a maternal grandmother had died within the previous two years. When mothers and daughters bred together, older-generation calves had a mortality hazard ratio of 1.7 versus younger-generation calves. These are death-rate comparisons, not individual probabilities, and do not prove one explanation for every species. Grandmother study. reproductive-conflict study.
Is stopping having babies the same as menopause?
No. Birth records show whether reproduction happened, not necessarily why it stopped. Hormonal or ovarian evidence helps test the cause. That is why the Bwindi gorilla result is "likely, not confirmed" and Ngogo has stronger physiological support. Gorilla study. chimpanzee study.
Do any animals get hot flashes?
No study we reviewed measured hot flashes in wild animals. Symptoms are very hard to study in the wild, so research focuses on births, ovaries and hormones. Comparative editorial.
Does any insect go through menopause?
One comes close. Older Japanese gall aphids stop reproducing and then defend their colony by gluing themselves to predators with wax. Original aphid report.
Sources
Source checks completed September 29, 2026, at the depth stated in How we built this. The original 2011 numerical appendix remains unavailable; its affected zoo percentages are withheld.
- Ellis S, Franks DW, Nattrass S, et al. "Postreproductive lifespans are rare in mammals." Ecology and Evolution 8:2482–2494 (2018). https://pmc.ncbi.nlm.nih.gov/articles/PMC5838047/
- Ellis S, Franks DW, Nattrass S, et al. "Analyses of ovarian activity reveal repeated evolution of post-reproductive lifespans in toothed whales." Scientific Reports 8:12833 (2018). https://www.nature.com/articles/s41598-018-31047-8
- Ellis S, Franks DW, Nielsen MLK, Weiss MN, Croft DP. "The evolution of menopause in toothed whales." Nature 627:579–585 (2024). https://www.nature.com/articles/s41586-024-07159-9
- Photopoulou T, Ferreira IM, Best PB, Kasuya T, Marsh H. "Evidence for a postreproductive phase in female false killer whales Pseudorca crassidens." Frontiers in Zoology 14:30 (2017). https://link.springer.com/article/10.1186/s12983-017-0208-y
- Wood BM, Negrey JD, Brown JL, et al. "Demographic and hormonal evidence for menopause in wild chimpanzees." Science 382:eadd5473 (2023). https://pmc.ncbi.nlm.nih.gov/articles/PMC10645439/
- Smit N, Robbins MM. "Post-reproductive lifespan in wild mountain gorillas." PNAS 122(42):e2510998122 (2025). https://pmc.ncbi.nlm.nih.gov/articles/PMC12557517/
- Walker ML. "Menopause in female rhesus monkeys." American Journal of Primatology 35:59–71 (1995). https://pmc.ncbi.nlm.nih.gov/articles/PMC10590078/
- Atsalis S, Margulis SW. "Sexual and hormonal cycles in geriatric Gorilla gorilla gorilla." International Journal of Primatology 27:1663–1687 (2006). https://link.springer.com/article/10.1007/s10764-006-9097-1
- MacLachlan N, Routh A, Hunt G, et al. "Diagnosis of menopause in a captive Sumatran orangutan (Pongo abelii)." Zoo Biology 44(1):87–91 (2025; published online October 22, 2024). https://onlinelibrary.wiley.com/doi/full/10.1002/zoo.21874
- Chapman SN, Jackson J, Htut W, Lummaa V, Lahdenperä M. "Asian elephants exhibit post-reproductive lifespans." BMC Evolutionary Biology 19:193 (2019). https://link.springer.com/article/10.1186/s12862-019-1513-1
- Nichols HJ, Arbuckle K, Fullard K, Amos W. "Why don't long-finned pilot whales have a widespread postreproductive lifespan? Insights from genetic data." Behavioral Ecology 31(2):508–518 (2020). https://academic.oup.com/beheco/article-abstract/31/2/508/5697334
- Nattrass S, Croft DP, Ellis S, et al. "Postreproductive killer whale grandmothers improve the survival of their grandoffspring." PNAS 116(52):26669–26673 (2019). https://pmc.ncbi.nlm.nih.gov/articles/PMC6936675/
- Croft DP, Johnstone RA, Ellis S, et al. "Reproductive conflict and the evolution of menopause in killer whales." Current Biology 27:298–304 (2017). https://repository.library.noaa.gov/view/noaa/59041
- Winkler I, Goncalves A. "Do mammals have menopause?" Cell 186:4729–4733 (2023). https://www.sciencedirect.com/science/article/pii/S0092867423010802
- Chapman SN, Ellis S, Lahdenperä M, Croft DP, Lummaa V. "Menopause has not evolved as a general trait in mammals: A response to 'Do mammals have menopause?'" bioRxiv preprint (2024). https://www.biorxiv.org/content/10.1101/2024.02.29.582687v1
- Gidlöf S, Engberg H, Jakson I. "Menopause in nonhuman mammals—What does it mean for the gynecologist?" Acta Obstetricia et Gynecologica Scandinavica 105(2):212–214 (2026; published online December 21, 2025). https://pmc.ncbi.nlm.nih.gov/articles/PMC12856693/
- Uematsu K, Kutsukake M, Fukatsu T, Shimada M, Shibao H. "Altruistic colony defense by menopausal female insects." Current Biology 20(13):1182–1186 (2010; online June 17, issue July 13). https://doi.org/10.1016/j.cub.2010.04.057 — original abstract checked via the author institution record.
- Hanim MS, Chotimanukul S. "Age-related canine reproductive health: impact on fertility and disorders." Journal of Veterinary Science 26(S1):S139–S156 (2025). https://vetsci.org/DOIx.php?id=10.4142%2Fjvs.25218
- Badger Creek Veterinary Clinic. "Cats – Why It's Important to Spay or Neuter." Updated July 21, 2025. https://badgercreekvetclinic.com/cats-why-its-important-to-spay-or-neuter/
- World Health Organization. "Menopause" fact sheet. October 16, 2024. https://www.who.int/news-room/fact-sheets/detail/menopause
- Lahdenperä M, Mar KU, Lummaa V. "Nearby grandmother enhances calf survival and reproduction in Asian elephants." Scientific Reports 6:27213 (June 10, 2016). https://www.nature.com/articles/srep27213
- Levitis DA, Burger O, Lackey LB. "The human post-fertile lifespan in comparative evolutionary context." Evolutionary Anthropology 22(2):66–79 (2013). https://doi.org/10.1002/evan.21332 — Table 1 and methods checked in the author-posted full text.
- Levitis DA, Lackey LB. "A measure for describing and comparing postreproductive life span as a population trait." Methods in Ecology and Evolution 2:446–453 (2011). https://besjournals.onlinelibrary.wiley.com/doi/full/10.1111/j.2041-210X.2011.00095.x — main text checked; original Appendix S2 numerical download blocked. The three affected zoo percentages are not published here.
The HRT Index Research is an independent research and reference resource on women's midlife health, built from dated primary sources and transparent methods.